 Back
BackOligopoly Models: Cournot and Bertrand Duopoly, Welfare Comparisons, and Nash Equilibrium
Study Guide - Smart Notes
 Tailored notes based on your materials, expanded with key definitions, examples, and context.
Oligopoly Models
Cournot Duopoly Model
The Cournot duopoly model describes a market structure where two firms simultaneously choose the quantity of output to produce, taking the other firm's output as given. The interaction leads to a Nash equilibrium known as the Cournot equilibrium.
Market Demand Function:
Cost Functions: Firm 1: , Firm 2:
Marginal Costs: MC1 = 120, MC2 = 150
Steps to Find Cournot Equilibrium:
Inverse Demand Function:
Firm 1's Revenue:
Firm 1's Marginal Revenue:
Set MR = MC for Firm 1:
Firm 2's Revenue:
Firm 2's Marginal Revenue:
Set MR = MC for Firm 2:
Solving the System:
Substitute and solve: ,
Conclusion: The Cournot equilibrium outputs are (350, 200). Firm 1 produces more due to its lower cost.
Bertrand Duopoly Model
The Bertrand duopoly model considers two firms that simultaneously choose prices. The Nash equilibrium in this setting is called the Bertrand equilibrium.
Key Features:
Firms set prices, not quantities.
Consumers buy from the firm with the lower price.
If prices are equal, firms share the market equally.
Example: , ,
Analysis of Possible Cases:
If : Firm 1 earns zero profit and can profitably undercut.
If : Firm 2 earns zero profit and can profitably raise price slightly.
If : Both firms share the market and can profitably undercut.
If : Both firms share the market and earn zero profit. No profitable deviation exists.
Bertrand Equilibrium: (equal to marginal cost). Both firms make zero profit, and the outcome matches the competitive equilibrium.
Comparison of Monopoly, Cournot, and Bertrand Outcomes
The three market structures—monopoly/cartel, Cournot duopoly, and Bertrand/competitive—differ in terms of output, price, profit, and total welfare.
Monopoly/Cartel | Cournot | Competitive/Bertrand | |
|---|---|---|---|
Total Output | Lowest | Intermediate | Highest |
Price | Highest | Intermediate | Lowest |
Total Profit | Highest | Intermediate | Lowest |
Total Welfare | Lowest | Intermediate | Highest |
Welfare Analysis in Different Market Structures
Welfare analysis examines how consumer surplus, producer surplus, and deadweight loss differ across market structures.
Consumer Surplus: The area above price and below the demand curve.
Producer Surplus: The area below price and above the marginal cost curve.
Deadweight Loss: The loss in total welfare due to market inefficiency (e.g., monopoly pricing).
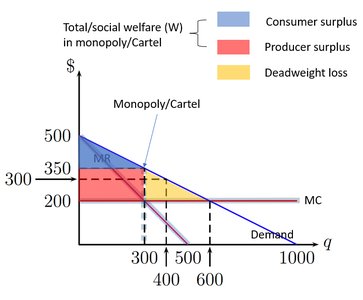
Monopoly/Cartel: Consumer surplus is lowest, producer surplus is highest, and deadweight loss is present due to restricted output and higher prices.
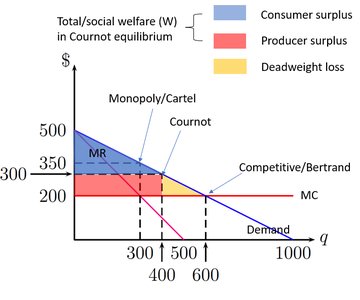
Cournot Equilibrium: Consumer surplus and total welfare are higher than monopoly but lower than competitive/Bertrand. Deadweight loss is reduced compared to monopoly.
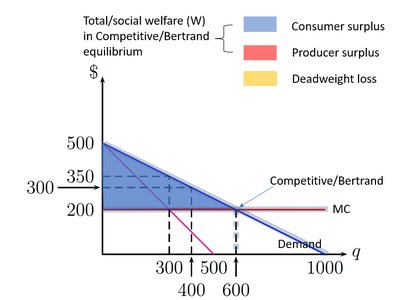
Competitive/Bertrand Equilibrium: Consumer surplus and total welfare are maximized, producer surplus is minimized, and deadweight loss is eliminated.
Extension: Bertrand Model with Discrete Prices
When prices are restricted to discrete increments (e.g., $0.01), the nature of Nash equilibrium can change.
Key Information: MC = 200 for both firms.
Nash Equilibrium Analysis:
(200, 200): Yes, both firms play a best response.
(200.01, 200.01): Yes, both firms play a best response.
(200, 200.01): No, firm 1 can profitably undercut.
(201, 201): No, undercutting is a profitable deviation.
Conclusion: The Bertrand model predicts highly competitive outcomes, but discrete pricing can allow for multiple Nash equilibria at or just above marginal cost.
Summary Table: Welfare and Market Outcomes
Market Structure | Output | Price | Profit | Total Welfare |
|---|---|---|---|---|
Monopoly/Cartel | Lowest | Highest | Highest | Lowest |
Cournot | Intermediate | Intermediate | Intermediate | Intermediate |
Competitive/Bertrand | Highest | Lowest | Lowest | Highest |
