 Back
Principles of Microeconomics: Optimization, Equilibrium, and Market Forces
Study Guide - Smart Notes
 Tailored notes based on your materials, expanded with key definitions, examples, and context.
Principles and Practice of Economics
Core Principles of Economics
Economics is the study of how individuals, firms, and governments make choices under conditions of scarcity. The three foundational principles of economics are:
Optimization: Making the best possible choice with the available information. All optimization problems involve trade-offs, as choosing one option typically means forgoing another.
Equilibrium: A situation in which everyone is optimizing and no individual would be better off by changing their behavior. For example, in a supermarket, if no one is switching checkout lanes, the system is in equilibrium.
Empiricism: Using data to answer economic questions and quantify the world. Empirical analysis is essential for validating economic theories.
Economic Agent: Any individual or group that makes choices, such as consumers, firms, or governments.
Scarcity: The condition of having unlimited wants in a world of limited resources. Economics studies how agents make choices among scarce resources and how those choices affect society.
Positive Economics: Describes what people actually do.
Normative Economics: Recommends what people, including society, ought to do.
Microeconomics: The study of individual, firm, and government choices.
Macroeconomics: The study of the economy as a whole.
Trade-offs: Arise when some benefits must be given up to gain others.
Budget Constraint: The set of things a person can choose to do or buy without exceeding their budget.
Opportunity Cost: The value of the best alternative forgone when making a choice.
Free Rider Problem: Occurs when individuals or groups benefit from resources or services without paying for them.
Optimization: Trying to Do the Best You Can
Optimization Techniques
Optimization involves selecting the best feasible option. Two main techniques are used:
Total Value: Calculate the net benefit (total benefit minus total cost) for each alternative and choose the highest.
Marginal Analysis: Focuses on the change in net benefit when moving from one alternative to another. This method is often faster and highlights what is changing.
Marginal Cost (MC): The change in costs when moving between alternatives.
Marginal Benefit (MB): The change in benefits when moving between alternatives.
Marginal Net Benefit (MNB): The change in net benefits between alternatives.
Principle of Optimization at the Margin: The optimal choice is the one where moving to it makes you better off, and moving away makes you worse off.
Demand, Supply, and Equilibrium
Market Fundamentals
A market is a group of economic agents trading a good or service, governed by rules and arrangements for trading. The market price is the price at which transactions occur.
Demand
Quantity Demanded: The amount of a good buyers are willing to purchase at a given price.
Demand Schedule: A table showing quantity demanded at different prices.
Demand Curve: A graph plotting quantity demanded at various prices. The curve is downward sloping due to diminishing marginal benefit: as more of a good is consumed, willingness to pay for additional units declines.
Law of Demand: Quantity demanded rises as price falls, holding all else equal.
Market Demand Curve: The sum of all individual demand curves in the market.
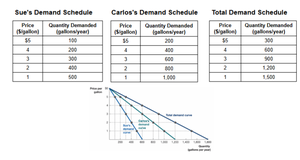
Shifts in the Demand Curve: Occur due to changes in tastes, income, prices of related goods, number of buyers, or expectations about the future. Only a change in the good's own price causes movement along the demand curve.
Normal Goods: Demand increases as income increases.
Inferior Goods: Demand decreases as income increases.
Complements: Goods consumed together; an increase in the price of one decreases demand for the other.
Substitutes: Goods used in place of each other; an increase in the price of one increases demand for the other.
Supply
Quantity Supplied: The amount of a good sellers are willing to sell at a given price.
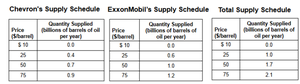
Supply Schedule: A table showing quantity supplied at different prices.
Supply Curve: A graph plotting quantity supplied at various prices. The curve is upward sloping because higher prices incentivize greater production.
Law of Supply: Quantity supplied rises as price rises, holding all else equal.
Market Supply Curve: The sum of all individual supply curves in the market.
Competitive Equilibrium
The competitive equilibrium is the point where the market comes to an agreement on price and quantity, such that quantity supplied equals quantity demanded. At this point, no agent can improve their outcome by changing behavior.
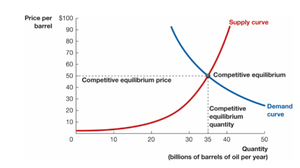
Excess Demand (Shortage): Occurs when quantity demanded exceeds quantity supplied at a given price, causing upward pressure on price.
Excess Supply (Surplus): Occurs when quantity supplied exceeds quantity demanded at a given price, causing downward pressure on price.
Shifts in Supply and Demand
Shifts in supply or demand curves change the equilibrium price and quantity. The direction and magnitude of these changes depend on which curve shifts and by how much.
If both supply and demand shift right, equilibrium quantity increases; price change is indeterminate without knowing the magnitude.
If both shift left, equilibrium quantity decreases; price change is indeterminate.
If one shifts right and the other left, the effect on price and quantity depends on the relative magnitude of the shifts.
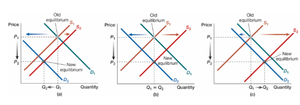
Example: If a new technology reduces production costs (supply shifts right) and consumer incomes rise (demand shifts right), the equilibrium quantity will increase, but the effect on price depends on which shift is larger.
Summary Table: Key Differences Between Demand and Supply
Aspect | Demand | Supply |
|---|---|---|
Definition | Willingness to buy at various prices | Willingness to sell at various prices |
Curve Slope | Downward (diminishing marginal benefit) | Upward (increasing marginal cost) |
Movement Along Curve | Change in price of the good | Change in price of the good |
Shifts in Curve | Tastes, income, related goods, buyers, expectations | Input prices, technology, sellers, expectations |
Additional info: Students should practice drawing and interpreting supply and demand graphs, especially when analyzing the effects of simultaneous shifts in both curves. Understanding the terminology and being able to explain why price and quantity change is essential for exam success.
