 Back
Production Costs, Profit, and Perfect Competition: Microeconomics Study Guide
Study Guide - Smart Notes
 Tailored notes based on your materials, expanded with key definitions, examples, and context.
Production Costs, Profit, and Perfect Competition
Introduction to Production and Costs
Understanding production costs and profit is essential for analyzing firm behavior in microeconomics. These concepts are foundational for exploring market structures such as perfect competition.
Production Function: Describes the relationship between inputs (such as labor and capital) and output.
Costs of Production: Includes both fixed and variable costs incurred by firms to produce goods and services.
Profit: The difference between total revenue and total cost.
Production Function and Inputs
The production function illustrates how firms transform inputs into outputs. Inputs can be classified as fixed or variable, depending on whether their quantity can be changed in the short run.
Fixed Inputs: Inputs that cannot be changed in the short run (e.g., factory size).
Variable Inputs: Inputs that can be adjusted in the short run (e.g., labor).
Short Run vs. Long Run: In the short run, at least one input is fixed; in the long run, all inputs can be varied.
Marginal Product and Total Product
Marginal product measures the additional output generated by adding one more unit of a variable input, while total product is the overall quantity produced.
Total Product (TP): The total quantity of output produced for a given amount of inputs.
Marginal Product (MP): The change in output resulting from a one-unit increase in the variable input.
Law of Diminishing Returns: As more units of a variable input are added to fixed inputs, the marginal product eventually decreases.

Short-Run Production Costs
Short-run production costs are divided into fixed and variable costs. Understanding these costs is crucial for determining profit and making production decisions.
Fixed Costs (FC): Costs that do not change with the level of output (e.g., rent).
Variable Costs (VC): Costs that vary with output (e.g., wages).
Total Cost (TC): The sum of fixed and variable costs.
Formulas:
(Average Variable Cost)
(Average Fixed Cost)
(Average Total Cost)
(Marginal Cost)
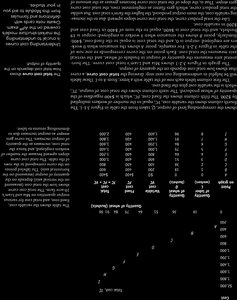
Cost Curves and Their Shapes
Cost curves illustrate how costs change as output increases. The shapes of these curves are influenced by the law of diminishing returns and economies of scale.
Average Cost Curves: Typically U-shaped due to initially decreasing costs (economies of scale) followed by increasing costs (diseconomies of scale).
Marginal Cost Curve: Intersects the average cost curve at its minimum point.

Perfect Competition
Perfect competition is a market structure characterized by many firms selling identical products, free entry and exit, and perfect information. Firms in perfect competition are price takers.
Characteristics: Large number of buyers and sellers, homogeneous products, no barriers to entry, and perfect information.
Profit Maximization: Firms maximize profit where marginal cost equals marginal revenue ().
Long-Run Equilibrium: Firms earn zero economic profit in the long run due to free entry and exit.
Tables: Production and Cost Data
Tables are used to compare output, costs, and productivity for different levels of input.
Quantity of Labor | Total Product (TP) | Marginal Product (MP) | Total Cost (TC) | Average Cost (AC) | Marginal Cost (MC) |
|---|---|---|---|---|---|
1 | 10 | 10 | 100 | 10 | 10 |
2 | 25 | 15 | 120 | 8 | 6.67 |
3 | 40 | 15 | 140 | 7 | 6.67 |
4 | 50 | 10 | 160 | 6.4 | 8 |
5 | 55 | 5 | 180 | 6.18 | 12 |
Additional info: Table values are inferred for illustrative purposes based on typical microeconomics examples.
Summary
Production costs and profit analysis are central to understanding firm behavior in microeconomics. The concepts of marginal product, average cost, and marginal cost are key to determining optimal production levels and understanding market structures such as perfect competition.
