 Back
BackChap 12.1 - Profit Maximization and Loss Minimization in Perfectly Competitive Markets
Study Guide - Smart Notes
 Tailored notes based on your materials, expanded with key definitions, examples, and context.
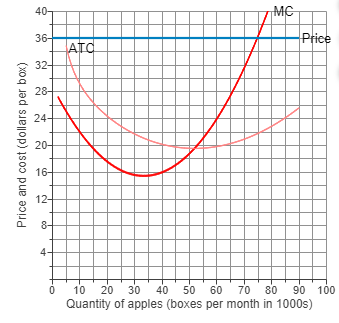
Q1. Farmer Smith grows apples. If the market price is $36 per box, how many thousand boxes should Farmer Smith produce to maximize profits?
Background
Topic: Profit Maximization in Perfect Competition
This question tests your understanding of how a firm in a perfectly competitive market determines its profit-maximizing output. The firm is a price taker and must decide how much to produce given the market price, its average total cost (ATC), and marginal cost (MC).
Key Terms and Formulas
Marginal Cost (MC): The additional cost of producing one more unit.
Average Total Cost (ATC): Total cost divided by quantity produced.
Profit Maximization Rule: In perfect competition, produce where (market price).
Step-by-Step Guidance
Examine the graph to identify where the marginal cost (MC) curve intersects the horizontal line representing the market price ($36).
Recall that in a perfectly competitive market, the firm maximizes profit by producing the quantity where .
Find the quantity (in thousands of boxes) at which the MC curve meets the price line. This is the output Farmer Smith should produce.
Check if the average total cost (ATC) at this quantity is less than the market price. If so, Farmer Smith will earn a profit; if ATC equals price, the firm breaks even.
Try solving on your own before revealing the answer!
Final Answer: 70 thousand boxes
At 70 thousand boxes, the MC curve intersects the price line at $36. This is the profit-maximizing output for Farmer Smith.
Since ATC is below $36 at this quantity, Farmer Smith will earn a profit.
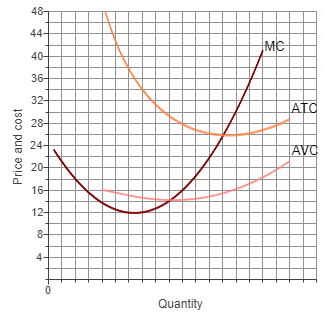
Q2. Assume the market price is $22. Use the graph to show a firm's demand curve, profit-maximizing price and quantity, and shade the firm's profit/loss.
Background
Topic: Loss Minimization in Perfect Competition
This question asks you to illustrate the concepts of demand, profit-maximizing output, and profit/loss for a firm operating at a loss in a perfectly competitive market.
Key Terms and Formulas
Demand Curve: For a price-taking firm, this is a horizontal line at the market price.
Profit-Maximizing Output: Where .
Profit/Loss Area: The difference between total revenue and total cost, often shaded on a graph.
Step-by-Step Guidance
Draw a horizontal line at to represent the firm's demand curve. Label this line 'Demand'.
Identify the intersection of the MC curve and the price line (). This is the profit-maximizing quantity and price. Mark this point as 'Point A'.
Observe the ATC curve at this quantity. If ATC is above $22$, the firm is operating at a loss.
Shade the area between the price line and the ATC curve, from zero to the profit-maximizing quantity. Label this shaded area as 'Loss'.
Try solving on your own before revealing the answer!
Final Answer:
The demand curve is a horizontal line at . 'Point A' is where MC = 22. The shaded area between and ATC at this quantity represents the firm's loss.
Since ATC > P at the profit-maximizing quantity, the firm incurs a loss, but this is minimized by producing where MC = P.
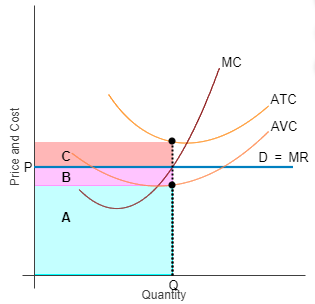
Q3. The graph represents a perfectly competitive firm. Identify the areas representing total cost, total revenue, variable cost, and loss.
Background
Topic: Cost and Revenue Areas in Perfect Competition
This question tests your ability to interpret cost and revenue areas on a graph for a perfectly competitive firm, including identifying profit or loss.
Key Terms and Formulas
Total Cost (TC): Area under the ATC curve up to the profit-maximizing quantity.
Total Revenue (TR): Area under the price line up to the profit-maximizing quantity.
Variable Cost (VC): Area under the AVC curve up to the profit-maximizing quantity.
Loss: The area where TC exceeds TR.
Step-by-Step Guidance
Locate the profit-maximizing quantity (Q) where MC = P.
Identify the area under the ATC curve up to Q; this is total cost.
Identify the area under the price line up to Q; this is total revenue.
Find the area under the AVC curve up to Q; this is variable cost.
The area where total cost exceeds total revenue represents the firm's loss.
Try solving on your own before revealing the answer!
Final Answer:
Total cost is area C, total revenue is area A + B, variable cost is area A, and loss is area C - (A + B).
These areas are visually represented on the graph, helping you understand the firm's financial situation.
Q4. Is the student's argument correct? Profits are maximized at Q1, not Q2, because the distance between price and marginal cost is greatest at Q1.
Background
Topic: Profit Maximization Rule
This question tests your understanding of the correct rule for profit maximization in perfectly competitive markets: whether maximizing the difference between price and marginal cost is the right approach.
Key Terms and Formulas
Profit Maximization: Occurs where (in perfect competition, ).
Distance between price and marginal cost: Not the correct criterion for maximizing profit.
Step-by-Step Guidance
Recall that the profit-maximizing output is where marginal revenue equals marginal cost ().
In perfect competition, marginal revenue equals price (), so the rule becomes .
Compare Q1 and Q2: At Q1, the difference between price and MC is greatest, but this is not the profit-maximizing rule.
At Q2, , which is the correct criterion for maximizing profit.
Try solving on your own before revealing the answer!
Final Answer:
A. Incorrect. Profits are maximized at the quantity where marginal revenue equals marginal cost, not where the difference between price and marginal cost is greatest.
The student's argument is incorrect because the correct rule is .
