Back
BackResource Allocation, Opportunity Cost, and Comparative Advantage: Core Concepts in Microeconomics
Study Guide - Smart Notes
 Tailored notes based on your materials, expanded with key definitions, examples, and context.
Resource Allocation and Economic Systems
Adam Smith and the Role of Self-Interest
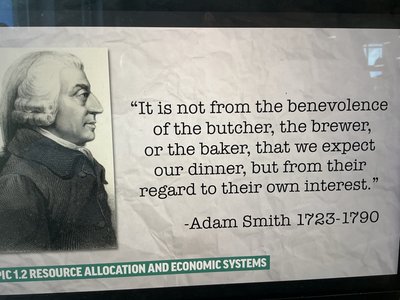
Adam Smith, often regarded as the father of modern economics, emphasized the importance of self-interest in economic transactions. According to Smith, individuals act based on their own interests, which inadvertently benefits society as a whole through the efficient allocation of resources.
Key Point: Economic agents (like butchers, brewers, and bakers) provide goods and services not out of benevolence, but because it serves their own interests.
Key Point: This self-interest leads to the production and distribution of goods that society needs.
Example: A baker bakes bread to earn a living, not just to feed others, but this action results in bread being available for society.
The Economic Problem: Scarcity and Choice
Production Possibilities Frontier (PPF)
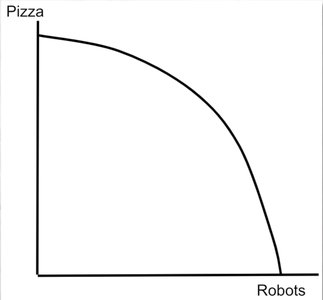
The Production Possibilities Frontier (PPF) illustrates the maximum possible combinations of two goods that an economy can produce given its resources and technology. The PPF demonstrates the concept of scarcity, choice, and opportunity cost.
Key Point: Points on the PPF represent efficient production levels; points inside are inefficient, and points outside are unattainable.
Key Point: The PPF is typically bowed outward due to the law of increasing opportunity cost.
Example: An economy can produce either pizza or robots, and the PPF shows the trade-off between the two.
Opportunity Cost
Opportunity cost is the value of the next best alternative foregone when a choice is made. It is a fundamental concept in economics, reflecting the trade-offs inherent in every decision.
Key Point: Moving along the PPF involves shifting resources from one good to another, incurring an opportunity cost.
Formula:
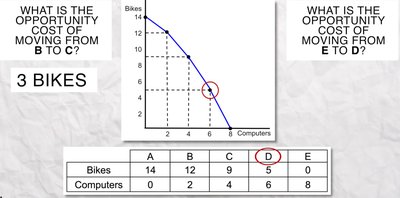
Example: If moving from point B to C on the PPF means producing 2 more computers but 3 fewer bikes, the opportunity cost of 2 computers is 3 bikes, or 1.5 bikes per computer.

Law of Increasing Opportunity Cost
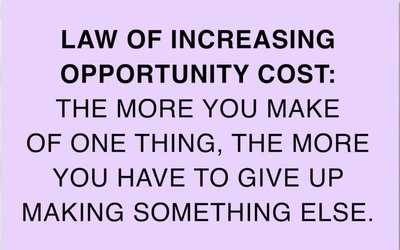
The law of increasing opportunity cost states that as production of one good increases, the opportunity cost of producing an additional unit of that good also increases. This occurs because resources are not equally efficient in producing all goods.
Key Point: The PPF is bowed outward due to this law.
Example: As more computers are produced, increasingly more bikes must be given up.
Constant Opportunity Cost
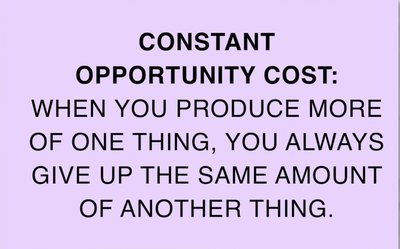
Constant opportunity cost occurs when the opportunity cost of producing one good in terms of another remains the same, regardless of the quantity produced. This is represented by a straight-line PPF.
Key Point: Resources are equally efficient in producing both goods.
Example: If each bike always costs 2 computers, regardless of the quantity produced, the opportunity cost is constant.
Comparative and Absolute Advantage
Absolute Advantage
A country or individual has an absolute advantage if they can produce more of a good with the same resources than another country or individual.
Key Point: Absolute advantage compares productivity between producers.
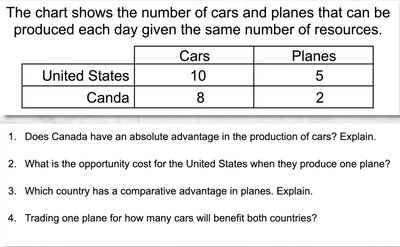
Example: If the United States can produce 10 cars per day and Canada can produce 8, the U.S. has an absolute advantage in cars.
Comparative Advantage
Comparative advantage exists when a country or individual can produce a good at a lower opportunity cost than another. This principle forms the basis for mutually beneficial trade.
Key Point: Even if one country has an absolute advantage in all goods, both can benefit from trade if they specialize according to comparative advantage.
Formula:
Example: If the U.S. gives up 2 cars for each plane and Canada gives up 4 cars for each plane, the U.S. has a lower opportunity cost in planes.
Practice Problems: Output and Input Tables
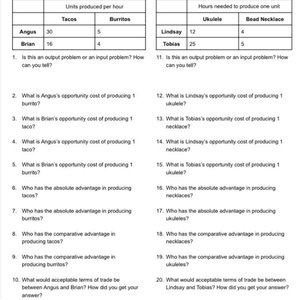
Comparative and absolute advantage can be analyzed using output (units produced per time) or input (time needed per unit) tables. Practice problems help reinforce these concepts.
Key Point: For output problems, the producer with the higher output has the absolute advantage; for input problems, the producer with the lower input has the absolute advantage.
Key Point: Opportunity cost calculations differ for output and input tables.
Marginal Analysis: Benefit vs. Cost
Marginal Benefit and Marginal Cost
Marginal analysis involves comparing the additional benefit of an action to its additional cost. Rational decision-makers undertake an activity if the marginal benefit exceeds the marginal cost.
Key Point: Marginal benefit typically decreases as more of an activity is undertaken, while marginal cost may remain constant or increase.
Formula:
Formula:
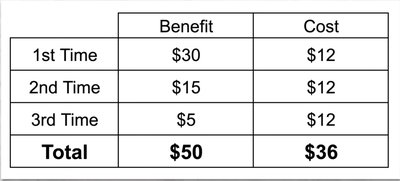
Example: If the benefit of the first activity is $30 and the cost is $12, the net benefit is $18. As more is done, the marginal benefit falls.