 Back
BackShort-Run Costs and Output Decisions in Perfect Competition
Study Guide - Smart Notes
 Tailored notes based on your materials, expanded with key definitions, examples, and context.
Short-Run Costs and Output Decisions
Introduction
This chapter explores the cost structures faced by firms in the short run and how these costs influence output decisions, especially in perfectly competitive markets. Understanding these concepts is essential for analyzing firm behavior and market outcomes in microeconomics.
Costs in the Short Run
Types of Costs
Fixed Cost (FC): Costs that do not vary with the level of output. These are incurred even if the firm produces nothing. There are no fixed costs in the long run.
Variable Cost (VC): Costs that change with the level of output produced.
Total Cost (TC): The sum of total fixed costs and total variable costs.
Fixed Costs
Total Fixed Cost (TFC): The total of all costs that do not change with output, even if output is zero.
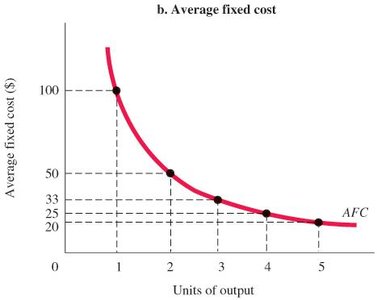
Average Fixed Cost (AFC): Total fixed cost divided by the number of units of output. AFC declines as output increases, a phenomenon known as spreading overhead.
Variable Costs
Total Variable Cost (TVC): The total of all costs that vary with output in the short run.
Total Variable Cost Curve: Shows the relationship between TVC and the level of output.
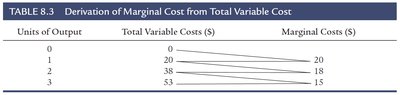
Marginal Cost (MC): The increase in total cost from producing one more unit of output. In the short run, MC typically decreases initially due to increasing returns, then rises due to diminishing returns.
Units of Output | Total Variable Costs ($) | Marginal Costs ($) |
|---|---|---|
0 | 0 | — |
1 | 20 | 20 |
2 | 38 | 18 |
3 | 53 | 15 |
Average Variable Cost (AVC)
Average Variable Cost (AVC): Total variable cost divided by the number of units of output.
Graphing Short-Run Costs
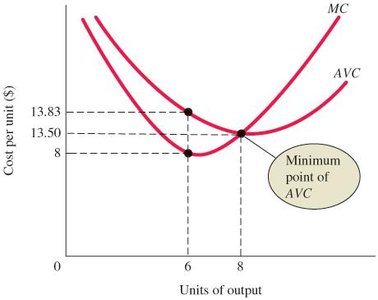
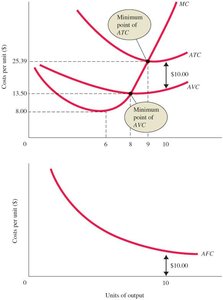
When MC is below AVC, AVC is declining; when MC is above AVC, AVC is rising.
The MC curve intersects the AVC curve at the minimum point of AVC.
Total Costs
Total Cost Curves
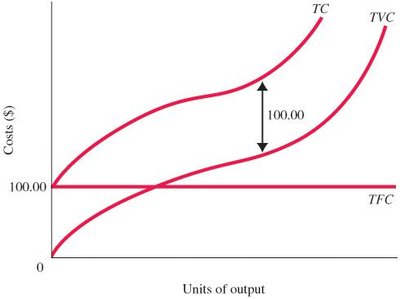
Adding TFC to TVC at every output level shifts the TVC curve upward by the amount of TFC, resulting in the TC curve.
Average Total Cost (ATC)
Average Total Cost (ATC): Total cost divided by the number of units of output.
ATC can also be expressed as the sum of AFC and AVC.
Summary Table of Cost Concepts
Term | Definition | Equation |
|---|---|---|
Accounting costs | Out-of-pocket (explicit) costs | — |
Economic costs | Explicit + implicit (opportunity) costs | — |
Total fixed costs (TFC) | Costs independent of output | — |
Total variable costs (TVC) | Costs that vary with output | — |
Total cost (TC) | Sum of all costs | |
Average fixed cost (AFC) | Fixed cost per unit | |
Average variable cost (AVC) | Variable cost per unit | |
Average total cost (ATC) | Total cost per unit | |
Marginal cost (MC) | Cost of one more unit |
Output Decisions: Revenues, Costs, and Profit Maximization
Perfect Competition
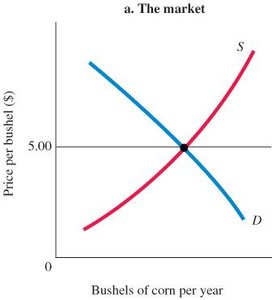
Perfect Competition: Many small firms, identical (homogeneous) products, no control over price, and free entry and exit.
Each firm faces a perfectly elastic demand curve at the market price.
Total Revenue and Marginal Revenue
Total Revenue (TR): The total amount received from sales, calculated as price times quantity.
Marginal Revenue (MR): The additional revenue from selling one more unit. In perfect competition, .
Profit Maximization
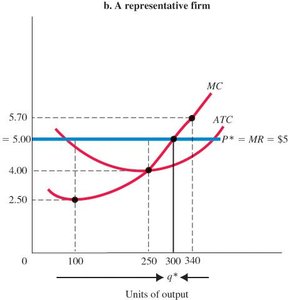
Firms maximize profit by producing the quantity where marginal revenue equals marginal cost ().
In perfect competition, this condition simplifies to .
Short-Run Supply Curve
The marginal cost curve above the shutdown point is the firm's short-run supply curve in perfect competition.
At any market price, the MC curve shows the profit-maximizing output level.
Key Terms and Equations
Average Fixed Cost (AFC):
Average Variable Cost (AVC):
Average Total Cost (ATC):
Marginal Cost (MC):
Total Revenue (TR):
Profit-Maximizing Output: (all firms), (perfect competition)
Example: Cost and Profit Analysis
q | TFC | TVC | MC | P = MR | TR | TC | Profit |
|---|---|---|---|---|---|---|---|
0 | 10 | 0 | — | 15 | 0 | 10 | -10 |
1 | 10 | 10 | 10 | 15 | 15 | 20 | -5 |
2 | 10 | 15 | 5 | 15 | 30 | 25 | 5 |
3 | 10 | 20 | 5 | 15 | 45 | 30 | 15 |
4 | 10 | 30 | 10 | 15 | 60 | 40 | 20 |
5 | 10 | 50 | 20 | 15 | 75 | 60 | 15 |
6 | 10 | 80 | 30 | 15 | 90 | 90 | 0 |
Example: The profit-maximizing output is where . In this table, the optimal output is between 4 and 5 units, where profit is maximized.
Summary
Short-run costs include fixed and variable components, which together determine total cost.
Firms in perfect competition maximize profit where price equals marginal cost.
The marginal cost curve above the shutdown point serves as the firm's short-run supply curve.
