 Back
BackChap 13 - Study Guidance: Monopolistic Competition in Microeconomics
Study Guide - Smart Notes
 Tailored notes based on your materials, expanded with key definitions, examples, and context.
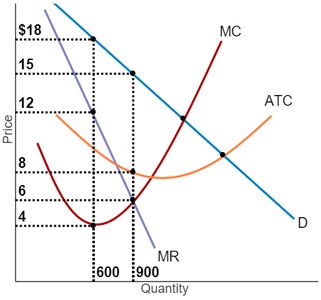
Q1. Refer to the graph. In order to maximize profit, what price should the firm charge?
Background
Topic: Profit Maximization in Monopolistic Competition
This question tests your understanding of how a firm in a monopolistically competitive market determines the price to charge in order to maximize profit. The graph shows the demand, marginal revenue (MR), marginal cost (MC), and average total cost (ATC) curves.
Key Terms and Formulas
Marginal Revenue (MR): The additional revenue from selling one more unit.
Marginal Cost (MC): The additional cost from producing one more unit.
Profit Maximization Rule: Firms maximize profit where .
Demand Curve: Shows the price consumers are willing to pay for each quantity.
Step-by-Step Guidance
Locate the point on the graph where the curve intersects the curve. This is the profit-maximizing quantity.
Draw a vertical line from this intersection point down to the quantity axis to identify the optimal quantity.
From the optimal quantity, move up vertically to the demand curve. The price at this point on the demand curve is the price the firm should charge to maximize profit.
Check the answer choices and match the price from the demand curve at the profit-maximizing quantity.
Try solving on your own before revealing the answer!
Final Answer: $15
At the profit-maximizing quantity (where ), the price on the demand curve is $15. This is the price the firm should charge to maximize profit.
This follows the rule that the firm charges the price consumers are willing to pay at the profit-maximizing output.
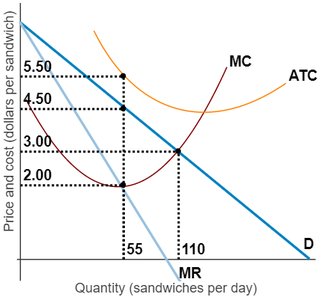
Q2. Suppose Angelica opens a small store near campus, selling beef brisket sandwiches. Use the graph to the right, which shows the demand and cost for Angelica’s beef brisket sandwiches, to answer the questions that follow.
Background
Topic: Profit Maximization for a Monopolistically Competitive Firm
This question asks you to determine the profit-maximizing quantity and price for a firm using a graph with demand, marginal revenue, marginal cost, and average total cost curves.
Key Terms and Formulas
Profit Maximization Rule:
Demand Curve: The price consumers are willing to pay at each quantity.
Step-by-Step Guidance
Find the intersection of the and curves on the graph. This gives the profit-maximizing quantity of sandwiches.
Draw a vertical line from this intersection down to the quantity axis to identify the number of sandwiches Angelica should sell.
From the profit-maximizing quantity, move up to the demand curve to find the price Angelica should charge.
Enter the quantity and price in the blanks provided, using the values from the graph.
Try solving on your own before revealing the answer!
Final Answer: 55 sandwiches per day, $4.50 per sandwich
At the intersection of and , the profit-maximizing quantity is 55 sandwiches, and the price on the demand curve at this quantity is $4.50.
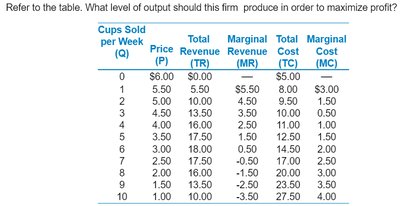
Q3. Refer to the table. What level of output should this firm produce in order to maximize profit?
Background
Topic: Using Marginal Revenue and Marginal Cost to Determine Optimal Output
This question tests your ability to use a table of marginal revenue and marginal cost to find the profit-maximizing output for a firm.
Key Terms and Formulas
Marginal Revenue (MR):
Marginal Cost (MC):
Profit Maximization Rule:
Step-by-Step Guidance
Scan the table to find the quantity where and are equal or closest.
Check that at this quantity, is not less than (if drops below , the firm should not produce more).
Identify the output level where or just before falls below .
Verify the total revenue and total cost at this output to ensure it is profit-maximizing.
Try solving on your own before revealing the answer!
Final Answer: 5 cups per week
At 5 cups, , which is the profit-maximizing output according to the table.
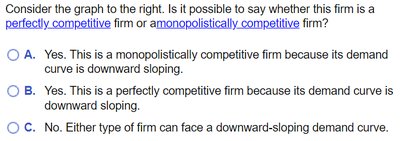
Q4. Consider the graph to the right. Is it possible to say whether this firm is a perfectly competitive firm or a monopolistically competitive firm?
Background
Topic: Market Structure Identification
This question tests your understanding of how to distinguish between perfectly competitive and monopolistically competitive firms based on the shape of the demand curve.
Key Terms and Formulas
Perfect Competition: Firms face a horizontal (perfectly elastic) demand curve.
Monopolistic Competition: Firms face a downward-sloping demand curve due to product differentiation.
Step-by-Step Guidance
Examine the demand curve in the graph. Is it horizontal or downward-sloping?
Recall that a downward-sloping demand curve indicates some market power and product differentiation.
Consider whether a perfectly competitive firm would ever face a downward-sloping demand curve.
Use this information to select the correct answer from the choices provided.
Try solving on your own before revealing the answer!
Final Answer: A. This is a monopolistically competitive firm because its demand curve is downward sloping.
Only monopolistically competitive firms face downward-sloping demand curves due to product differentiation.
