 Back
Study Guide: The Interaction of Demand and Supply in Microeconomics
Study Guide - Smart Notes
 Tailored notes based on your materials, expanded with key definitions, examples, and context.
The Interaction of Demand and Supply
The Demand Side of the Market
The demand side of the market focuses on how buyers behave and how their decisions determine the market demand for goods and services. Market demand is the total demand by all consumers for a given good or service.
Demand: Created by consumers; refers to the willingness and ability to purchase goods.
Quantity demanded: The amount of a good buyers are willing and able to purchase at a given price.
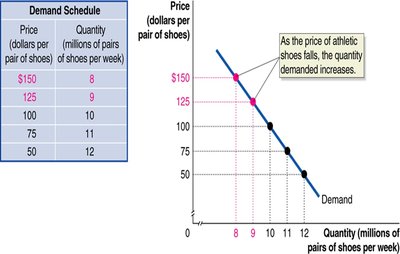
Law of Demand: All else equal (ceteris paribus), the quantity demanded of a good falls when the price rises.
Demand Schedule: A table showing the relationship between price and quantity demanded.
Demand Curve: A graph showing the relationship between price and quantity demanded, typically downward sloping.
Key determinants of demand: Price, income, prices of related goods, tastes, population, expected future prices, and external events.
Movements Along vs. Shifts of the Demand Curve
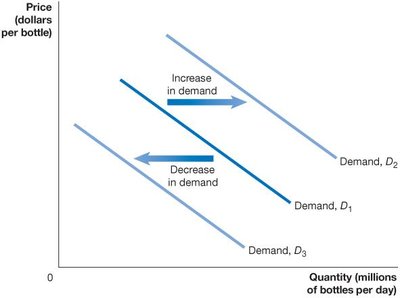
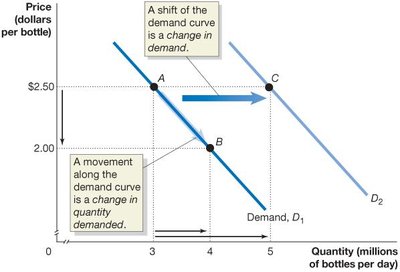
Changes in price cause movements along the demand curve, while changes in non-price determinants cause the entire demand curve to shift.
Movement along the curve: Caused by a change in the price of the product.
Shift of the curve: Caused by changes in income, prices of related goods, tastes, population, expectations, or external events.
Variables That Shift Demand
Income: Increase in income increases demand for normal goods, decreases demand for inferior goods.
Price of related goods: Substitutes (increase in price of one increases demand for the other), complements (increase in price of one decreases demand for the other).
Tastes: Changes in consumer preferences affect demand.
Population and demographics: More buyers increase demand.
Expected future prices: Anticipation of price changes affects current demand.
Natural disasters and pandemics: Can decrease or increase demand for certain goods.
Application: Reducing Smoking
To reduce the quantity of cigarettes demanded, policymakers can either shift the demand curve (e.g., through warnings or bans) or raise the price (e.g., through taxes).
Shifts vs. Movements Example
Shift: Warnings shift the demand curve left, reducing quantity demanded at every price.
Movement: Taxes raise price, causing movement along the demand curve and reducing quantity demanded.
The Supply Side of the Market
Supply Fundamentals
The supply side examines how producers decide how much of a product to offer at various prices. Supply is created by producers, and the supply curve shows the relationship between price and quantity supplied.
Quantity supplied: The amount sellers are willing and able to sell at a given price.
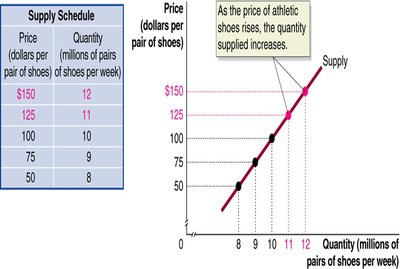
Law of Supply: Other things equal, the quantity supplied rises as the price rises.
Supply Schedule: A table showing the relationship between price and quantity supplied.
Supply Curve: A graph showing the relationship between price and quantity supplied, typically upward sloping.
Movements Along vs. Shifts of the Supply Curve
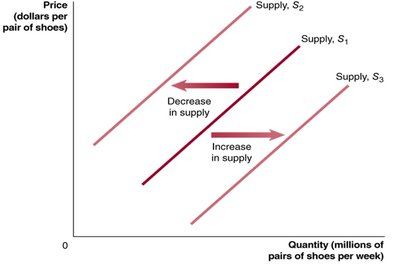
Changes in price cause movements along the supply curve, while changes in non-price determinants cause the entire supply curve to shift.
Movement along the curve: Caused by a change in the price of the product.
Shift of the curve: Caused by changes in input prices, technology, prices of related goods, number of firms, expectations, or external events.
Variables That Shift Supply
Prices of inputs: Higher input prices decrease supply; lower input prices increase supply.
Technological change: Advances reduce costs and increase supply.
Prices of related goods in production: Substitutes and complements in production affect supply decisions.
Number of firms: More firms increase supply.
Expected future prices: Anticipation of higher prices may decrease current supply.
Natural disasters and pandemics: Disruptions decrease supply.


Market Equilibrium: Putting Demand and Supply Together
Equilibrium Price and Quantity
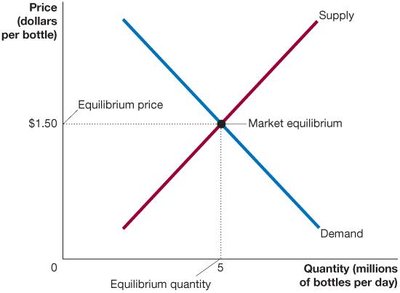
Market equilibrium occurs where the supply and demand curves intersect, determining the equilibrium price and quantity.
Equilibrium price: The price at which quantity supplied equals quantity demanded.
Equilibrium quantity: The quantity at which supply and demand are balanced.
Surpluses and Shortages
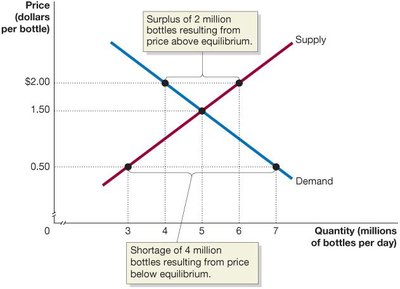
Surplus: Occurs when price is above equilibrium; quantity supplied exceeds quantity demanded. Producers lower prices to eliminate surplus.
Shortage: Occurs when price is below equilibrium; quantity demanded exceeds quantity supplied. Sellers raise prices to eliminate shortage.
Analyzing Changes in Equilibrium
To analyze how events affect equilibrium:
Decide whether the event shifts the supply or demand curve (or both).
Determine the direction of the shift.
Use the supply-and-demand diagram to see how equilibrium price and quantity change.
Summary Table: Effects of Shifts in Supply and Demand
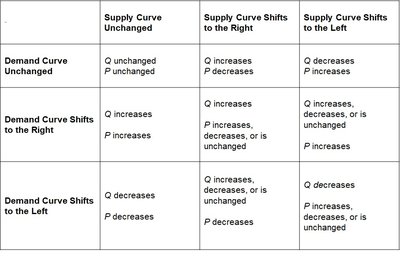
The table below summarizes how shifts in supply and demand affect equilibrium price and quantity:
Supply Curve Unchanged | Supply Curve Shifts to the Right | Supply Curve Shifts to the Left | |
|---|---|---|---|
Demand Curve Unchanged | Q unchanged P unchanged | Q increases P decreases | Q decreases P increases |
Demand Curve Shifts to the Right | Q increases P increases | Q increases P increases, decreases, or is unchanged | Q increases, decreases, or is unchanged P increases |
Demand Curve Shifts to the Left | Q decreases P decreases | Q increases, decreases, or is unchanged P decreases | Q decreases P increases, decreases, or is unchanged |
Key Formulas
Demand Function:
Supply Function:
Equilibrium Condition:
Examples and Applications
Normal vs. Inferior Goods: New clothes are normal goods; instant noodles are inferior goods.
Substitutes vs. Complements: Big Mac and Whopper are substitutes; hot dogs and buns are complements.
Policy Application: To reduce smoking, shift demand left (warnings) or move along the curve (taxes).
Additional info: Academic context was added to clarify definitions, examples, and formulas for self-contained study notes.
