 Back
BackSupply and Demand: Foundations of Market Analysis
Study Guide - Smart Notes
 Tailored notes based on your materials, expanded with key definitions, examples, and context.
Supply and Demand
Introduction to Supply and Demand
The supply and demand model is a fundamental framework in microeconomics for understanding how prices and quantities are determined in competitive markets. This chapter covers the determinants of demand and supply, the concept of market equilibrium, the effects of shocks and government interventions, and the aggregation of individual behaviors into market outcomes.

Demand
Determinants of Demand
Demand for a good is influenced by several factors, each of which can shift the demand curve:
Price of the good: The most direct determinant; as price changes, quantity demanded changes (movement along the curve).
Tastes: Consumer preferences can increase or decrease demand.
Information: Knowledge about the good (e.g., health effects) can shift demand.
Prices of other goods: Includes complements (goods used together) and substitutes (goods used in place of each other).
Income: Higher income generally increases demand for normal goods and decreases it for inferior goods.
Government rules and regulations: Taxes, subsidies, and regulations can affect demand.
Other factors: Such as expectations about future prices or demographic changes.
The Demand Curve
The demand curve shows the quantity of a good that consumers are willing to buy at each possible price, holding other factors constant. The law of demand states that, all else equal, consumers demand more of a good when its price is lower.
Quantity demanded: The amount consumers are willing to buy at a specific price.
Movement along the curve: Caused by a change in the good's own price.
Shift of the curve: Caused by changes in other determinants (e.g., income, tastes).


The Demand Function
The demand function expresses quantity demanded as a function of price and other variables:
where is quantity demanded, is the price of the good, is the price of beef, is the price of chicken, and is consumer income.
Example (linear demand function for pork):
Given , , :
Inverse Demand Function
The inverse demand function expresses price as a function of quantity:
Summing Demand Curves
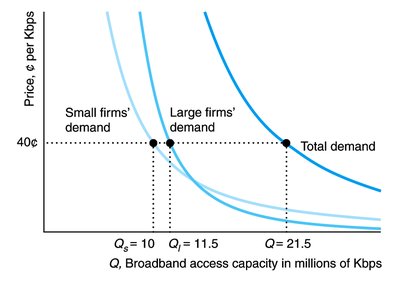
The market demand curve is the horizontal sum of individual demand curves:
Supply
Determinants of Supply
Supply for a good is determined by:
Price of the good: Higher prices generally increase quantity supplied.
Costs: Input prices and technology affect production costs and supply.
Government rules and regulations: Taxes, subsidies, and regulations can shift supply.
The Supply Curve
The supply curve shows the quantity of a good that firms are willing to sell at each price, holding other factors constant. Movement along the curve is due to price changes; shifts are due to changes in costs or regulations.


The Supply Function
The supply function expresses quantity supplied as a function of price and input costs:
where is the price of hogs (input).
Example (linear supply function for pork):
Given :
Summing Supply Curves
The market supply curve is the horizontal sum of individual supply curves (domestic and foreign):

Market Equilibrium
Definition and Determination
Market equilibrium occurs where quantity demanded equals quantity supplied. The equilibrium price is where consumers can buy as much as they want and sellers can sell as much as they want.
Excess demand: Quantity demanded exceeds quantity supplied at a given price.
Excess supply: Quantity supplied exceeds quantity demanded at a given price.

Mathematical Solution for Equilibrium
Set and solve for and :
Example: Set equal:
General Equilibrium Solution
For general linear functions:
Demand: Supply: Equilibrium:
Shocking the Equilibrium
Shifts in Demand or Supply
Equilibrium changes only if a shock occurs that shifts the demand or supply curve. Shocks include changes in tastes, income, input prices, or government policy.


Government Interventions
Types and Effects
Government policies can shift supply or demand, or cause the quantity demanded to differ from quantity supplied:
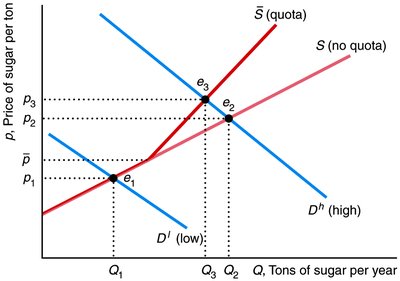
Licensing laws, quotas: Shift supply curves.
Price ceilings, price floors: Cause market imbalances (excess demand or supply).

Quotas and Price Controls
Quotas limit the quantity that can be imported or sold, shifting the supply curve and raising prices if binding. Price ceilings (maximum prices) and price floors (minimum prices) prevent the market from reaching equilibrium, creating shortages or surpluses.

Perfectly Competitive Markets
Characteristics
In perfectly competitive markets:
All participants are price takers.
Firms sell identical products.
Full information is available to all.
Trading costs are low.
Summary Table: Key Concepts in Supply and Demand
Concept | Definition | Example |
|---|---|---|
Demand Curve | Shows quantity demanded at each price | Q = 286 - 20p |
Supply Curve | Shows quantity supplied at each price | Q = 88 + 40p |
Equilibrium | Where Qd = Qs | p* = 3.30, Q* = 220 |
Excess Demand | Qd > Qs at a price | Shortage |
Excess Supply | Qs > Qd at a price | Surplus |
Quota | Limit on quantity supplied | Import quota on sugar |
Price Ceiling | Maximum legal price | Rent control |
Price Floor | Minimum legal price | Minimum wage |
