 Back
Supply, Demand, and Competitive Equilibrium: Microeconomics Study Guide
Study Guide - Smart Notes
 Tailored notes based on your materials, expanded with key definitions, examples, and context.
Supply, Demand, and Competitive Equilibrium
Introduction to Competitive Markets
Competitive markets are fundamental to microeconomics, characterized by many buyers and sellers trading identical goods or services. No single buyer or seller can influence the market price, ensuring that prices are determined by overall market forces.
Perfect Competition: All sellers offer identical goods, and no individual can affect the market price.
Market Price: The price at which transactions occur between buyers and sellers.
Competitive Equilibrium: The point where quantity demanded equals quantity supplied.
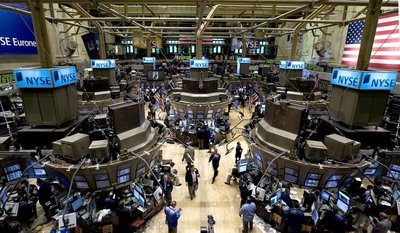
Markets and Market Price
A market consists of economic agents trading goods or services under specific rules. The market price is the agreed-upon price for these transactions.
Examples: Stock exchanges, car dealerships, local produce markets.


Demand
Demand Curve and Demand Schedule
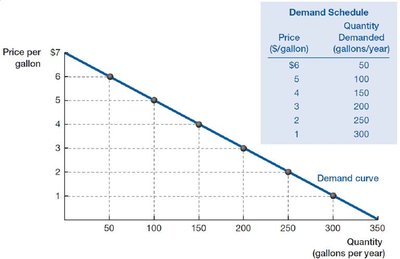
The demand curve shows the relationship between the price of a good and the quantity demanded by buyers. The demand schedule is a table listing quantities demanded at various prices.
Quantity Demanded: Amount buyers are willing to purchase at a given price.
Law of Demand: Quantity demanded increases as price decreases, ceteris paribus.
Market Demand Curve
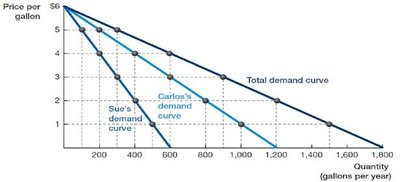
The market demand curve aggregates individual demand curves, showing total quantity demanded at each price.
Aggregation: Summing individual demand schedules to form the market demand.
Shifts vs. Movements Along the Demand Curve
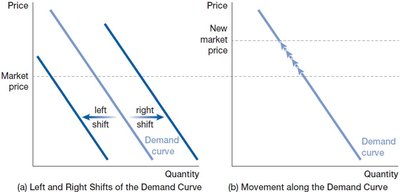
Movements along the demand curve are caused by changes in the good's own price. Shifts occur when other factors change, such as tastes, income, prices of related goods, number of buyers, or expectations.
Movement Along: Change in quantity demanded due to price change.
Shift: Change in demand due to external factors.
Supply
Supply Curve and Supply Schedule
The supply curve shows the relationship between the price of a good and the quantity supplied by sellers. The supply schedule is a table listing quantities supplied at various prices.
Quantity Supplied: Amount sellers are willing to sell at a given price.
Law of Supply: Quantity supplied increases as price increases, ceteris paribus.
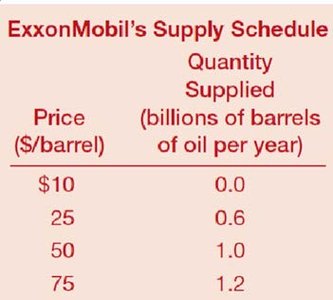
Market Supply Curve
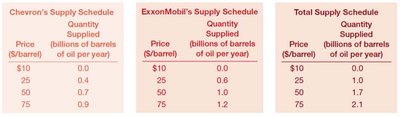
The market supply curve aggregates individual supply curves, showing total quantity supplied at each price.
Aggregation: Summing individual supply schedules to form the market supply.
Shifts vs. Movements Along the Supply Curve
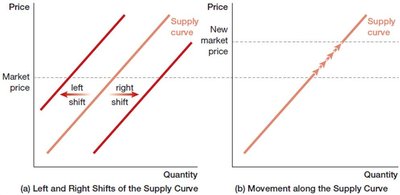
Movements along the supply curve are caused by changes in the good's own price. Shifts occur when input prices, technology, number of sellers, or expectations change.
Movement Along: Change in quantity supplied due to price change.
Shift: Change in supply due to external factors.
Equilibrium
Competitive Equilibrium
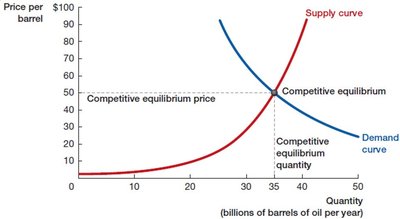
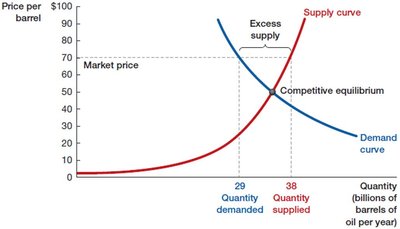
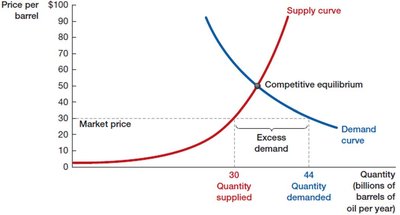
Competitive equilibrium is the point where the market price equates quantity demanded and quantity supplied. This determines the equilibrium price and quantity.
Excess Demand: When quantity demanded exceeds quantity supplied, causing a shortage.
Excess Supply: When quantity supplied exceeds quantity demanded, causing a surplus.
Shifts in Supply and Demand
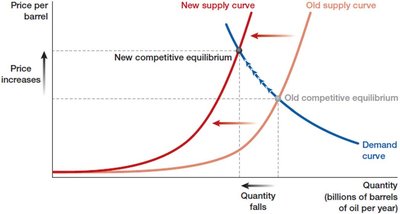
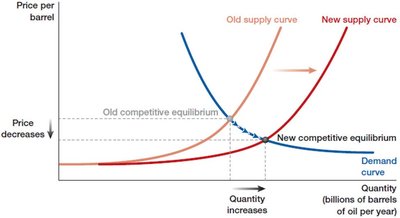
Shifts in supply or demand curves change the equilibrium price and quantity. A leftward shift in supply decreases quantity and increases price, while a rightward shift increases quantity and decreases price.
Applications: Eggs and Roses
Why Do Brown Eggs Cost More Than White Eggs?
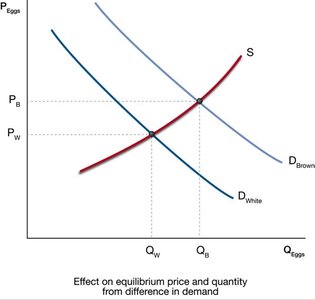
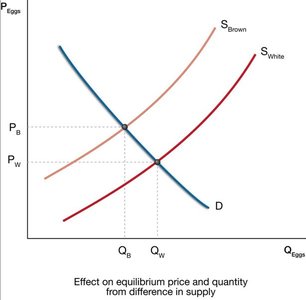
The price difference between brown and white eggs can be explained by supply and demand. Brown eggs are more expensive to produce due to larger hens requiring more food, shifting the supply curve leftward. Demand-side factors, such as perceptions of health or organic quality, may also shift the demand curve.


Key Points:
Brown eggs cost more due to higher production costs (supply shift).
Demand for brown eggs may be higher if perceived as healthier (demand shift).
Nutrient levels are not significantly different between white and brown eggs.
Why Do Rose Prices Increase Before Valentine’s Day?
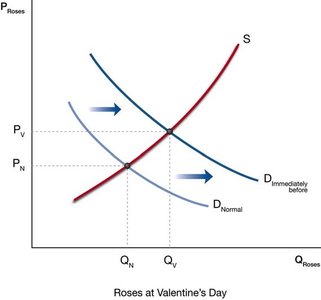
Rose prices rise before Valentine’s Day due to a rightward shift in the demand curve as more buyers seek roses. The supply curve may remain unchanged, leading to higher equilibrium prices.
Demand increases sharply before Valentine’s Day, raising prices.
Supply may not adjust quickly, resulting in higher equilibrium price.
Mathematical Representation of Supply and Demand
Demand and Supply Functions
Supply and demand can be represented mathematically. For example:
Demand:
Supply:
Equilibrium:
Solving for equilibrium:
Additional info: Mathematical models help predict market outcomes and analyze shifts in supply and demand.
Practice Problems
Examples and Applications
Drawing demand curves for goods with fixed quantity demanded (e.g., appendectomies).
Analyzing markets with only one buyer and stepwise demand curves.
Illustrating effects of simultaneous shifts in supply and demand (e.g., umbrellas during wet spring and flooding).
Exploring negative equilibrium prices (e.g., crude oil market in Cushing, Oklahoma, April 2020).
Additional info: Practice problems reinforce understanding of supply, demand, and equilibrium concepts.
