 Back
BackSupply, Demand, and Market Equilibrium: Microeconomics Study Notes
Study Guide - Smart Notes
 Tailored notes based on your materials, expanded with key definitions, examples, and context.
Supply, Demand, and Market Equilibrium
Introduction to Markets and Demand
Understanding how buyers and sellers interact in markets is fundamental to microeconomics. This section explores the behavior of consumers (demand) and producers (supply), focusing on perfectly competitive markets where many buyers and sellers trade identical products with no barriers to entry.
Demand
Individual and Market Demand Curves
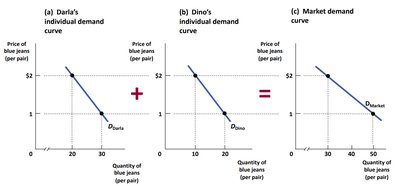
The individual demand curve shows the quantity of a good an individual is willing and able to purchase at each price. The market demand curve is the horizontal sum of all individual demand curves in the market.
Quantity demanded: The amount of a good or service that a consumer is willing and able to purchase at a given price.
Ceteris paribus: The assumption that all other variables are held constant except the one being studied (usually price).
Demand Schedules and Demand Curves
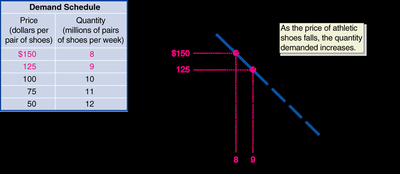
A demand schedule is a table showing the relationship between the price of a good and the quantity demanded. The demand curve is a graphical representation of this relationship, typically downward sloping, indicating that as price falls, quantity demanded increases.
As price decreases, quantity demanded increases (law of demand).
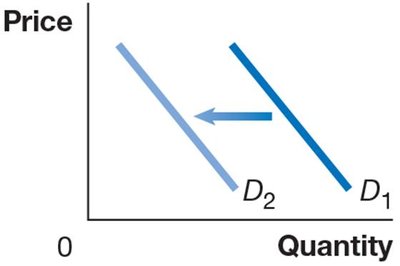
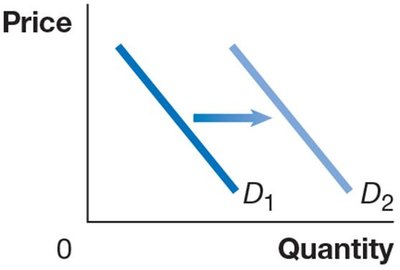
Shifting the Demand Curve
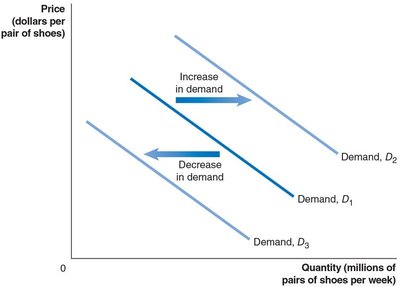
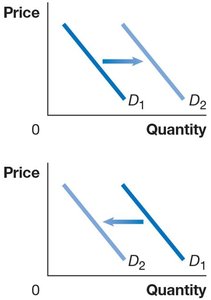
A shift in the demand curve occurs when a non-price determinant of demand changes, altering the quantity demanded at every price. This is different from a movement along the curve, which is caused by a change in the good's own price.
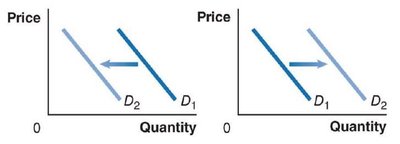
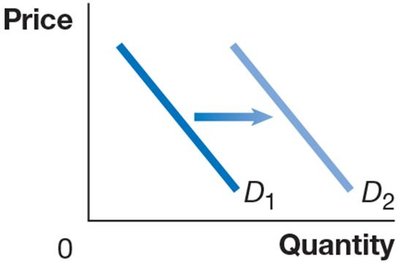
Increase in demand: Demand curve shifts right.
Decrease in demand: Demand curve shifts left.
Variables That Shift Market Demand
Several factors can shift the demand curve:
Prices of related goods: Substitutes (used in place of each other) and complements (used together).
Income: Normal goods (demand increases as income rises) and inferior goods (demand increases as income falls).
Tastes: Changes in consumer preferences.
Population and demographics: Changes in the number or characteristics of buyers.
Natural disasters and pandemics: Events that alter consumer preferences or ability to purchase.
Expected future prices: Anticipation of future price changes can affect current demand.
Changes in Income of Consumers
When income increases, demand for normal goods rises, while demand for inferior goods falls. The opposite occurs when income decreases.
Changes in Tastes
If consumer tastes shift in favor of a product, demand increases; if tastes shift away, demand decreases.
Changes in Population/Demographics
Growth in population or changes in demographic composition (such as age or gender) can increase or decrease demand for certain goods.
Natural Disasters and Pandemics
Events like pandemics can cause sudden changes in demand for specific goods and services, as consumer preferences and needs shift.
Changes in Expectations About Future Prices
If consumers expect prices to rise in the future, current demand increases. If they expect prices to fall, current demand decreases.
The Law of Demand: Substitution and Income Effects
The law of demand states that, holding everything else constant, when the price of a product falls, the quantity demanded increases, and when the price rises, the quantity demanded decreases. Two effects explain this:
Substitution effect: Consumers substitute toward goods that have become relatively cheaper.
Income effect: A lower price increases consumers' purchasing power, allowing them to buy more.
Supply
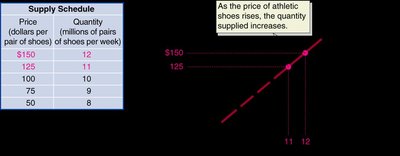
Supply Schedules and Supply Curves
A supply schedule is a table showing the relationship between the price of a good and the quantity supplied. The supply curve is a graphical representation, typically upward sloping, indicating that as price rises, quantity supplied increases.
Quantity supplied: The amount of a good or service that a firm is willing and able to supply at a given price.
Law of supply: Holding everything else constant, increases in price cause increases in the quantity supplied, and decreases in price cause decreases in the quantity supplied.
Individual and Market Supply Curves
Like demand, the market supply curve is the horizontal sum of all individual supply curves in the market.
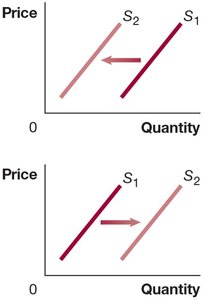
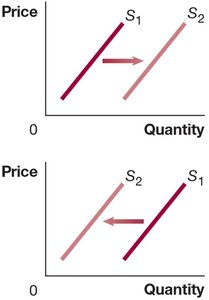
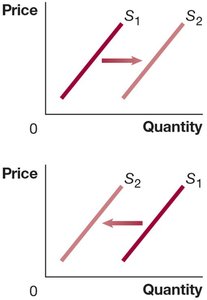
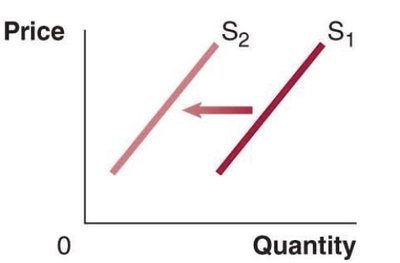
Shifting the Supply Curve
A shift in the supply curve occurs when a non-price determinant of supply changes, altering the quantity supplied at every price.
Increase in supply: Supply curve shifts right.
Decrease in supply: Supply curve shifts left.
Variables That Shift Market Supply
Several factors can shift the supply curve:
Prices of inputs: Higher input prices decrease supply; lower input prices increase supply.
Technological change: Improvements increase supply; setbacks decrease supply.
Prices of related goods in production: Substitutes and complements in production affect supply decisions.
Number of firms in the market: More firms increase supply; fewer firms decrease supply.
Expected future prices: If firms expect higher prices in the future, they may decrease current supply.
Natural disasters and pandemics: Disruptions reduce supply.
Technological Change
Technological advancements allow firms to produce more output with the same inputs, shifting supply right. Negative changes (e.g., new regulations) can shift supply left.
Number of Firms and Expected Future Prices
An increase in the number of firms increases market supply. If firms expect higher future prices, they may withhold supply now, decreasing current supply.
Natural Disasters and Pandemics
Disruptions in production due to disasters or pandemics reduce the quantity supplied at every price.
Market Equilibrium
Definition and Determination
Market equilibrium occurs where the quantity demanded equals the quantity supplied. The corresponding price is the equilibrium price, and the quantity is the equilibrium quantity.
At equilibrium, there is no tendency for price to change unless an external factor shifts demand or supply.
Surpluses and Shortages
If the market price is above equilibrium, a surplus occurs (quantity supplied > quantity demanded). If the price is below equilibrium, a shortage occurs (quantity demanded > quantity supplied). These imbalances create pressure for the price to move toward equilibrium.
How Shifts in Demand and Supply Affect Equilibrium
Changes in demand or supply shift the equilibrium price and quantity. The direction of change depends on which curve shifts and in which direction. The following table summarizes the effects:
Supply Curve Unchanged | Supply Curve Shifts Right | Supply Curve Shifts Left | |
|---|---|---|---|
Demand Curve Unchanged | Q unchanged P unchanged | Q increases P decreases | Q decreases P increases |
Demand Curve Shifts Right | Q increases P increases | Q increases P increases, decreases, or unchanged | Q increases, decreases, or unchanged P increases |
Demand Curve Shifts Left | Q decreases P decreases | Q increases, decreases, or unchanged P decreases | Q decreases P increases, decreases, or unchanged |
Finding Market Equilibrium Algebraically
To find equilibrium when given supply and demand equations:
Identify which equation is demand and which is supply.
Express both equations in the same form (e.g., and or for both).
Set the equations equal to each other.
Solve for the unknown (quantity or price).
Substitute back to find the other variable.
Example: If and , set and solve for :
Then substitute into either equation to find .
