 Back
Supply, Demand, and Market Equilibrium: Microeconomics Study Notes
Study Guide - Smart Notes
 Tailored notes based on your materials, expanded with key definitions, examples, and context.
The Interaction of Supply and Demand
Competitive Markets
A competitive market is characterized by many buyers and sellers trading identical goods or services. In such markets, individual participants have little influence over the market price, which is determined by the collective actions of all buyers and sellers.
The Demand Curve
Demand Schedule and Law of Demand
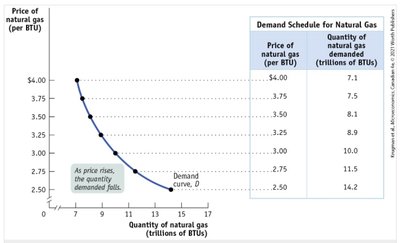
The demand schedule is a table that shows the quantity of a good consumers are willing to purchase at various prices. The demand curve is a graphical representation of this relationship, typically sloping downward, reflecting the law of demand: as price increases, quantity demanded decreases, all else equal.
Movement along the demand curve: Caused by a change in the price of the good itself.
Shifts in the demand curve: Caused by changes in factors other than the price of the good, such as income, tastes, expectations, number of consumers, and prices of related goods.
Factors causing shifts in demand:
Changes in income (affecting normal and inferior goods)
Changes in tastes
Changes in expectations about future prices or income
Changes in the number of consumers
Changes in the price of substitutes or complementary goods
Examples:
If McDonald's increases its menu prices, demand for Burger King may increase (substitute effect).
Rising gas prices may decrease demand for gas-powered cars (complement effect).
The Supply Curve
Supply Schedule and Law of Supply
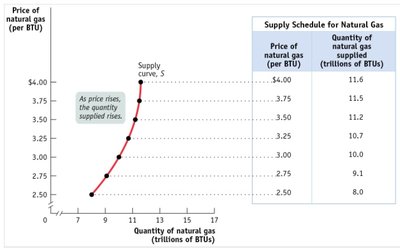
The supply schedule is a table showing the quantity of a good producers are willing to supply at different prices. The supply curve is a graphical representation, typically sloping upward, reflecting the law of supply: as price increases, quantity supplied increases, all else equal.
Movement along the supply curve: Caused by a change in the price of the good itself.
Shifts in the supply curve: Caused by changes in input prices, prices of related goods, technology, expectations, and number of producers.
Factors causing shifts in supply:
Changes in input prices (e.g., labor, raw materials)
Changes in prices of related goods or services
Technological improvements
Changes in expectations about future prices
Changes in the number of producers
Supply, Demand, and Equilibrium
Market Equilibrium
Market equilibrium occurs where the supply and demand curves intersect, determining the equilibrium price and equilibrium quantity. At this point, the quantity supplied equals the quantity demanded.
Surplus: If the market price is above equilibrium, quantity supplied exceeds quantity demanded. Producers lower prices, reducing supply and increasing demand until equilibrium is restored.
Shortage: If the market price is below equilibrium, quantity demanded exceeds quantity supplied. Producers raise prices, increasing supply and reducing demand until equilibrium is restored.
Examples of Shifts and Equilibrium Changes
Large influx of refugees in Canada: Increases demand for home rentals, shifting the demand curve right. Equilibrium price and quantity both rise.
War in Ukraine and gas prices: Higher gas prices decrease demand for gas vehicles, shifting demand left. Equilibrium price and quantity fall.
Increase in gas prices affecting airplane flights: Higher input costs shift supply curve left for flights, raising prices and lowering quantity.
Technological improvement in gas refining and warm winter: Technology shifts supply right (lower prices, higher quantity); warm winter may reduce demand, shifting demand left (lower prices, lower quantity). Net effect depends on magnitude of shifts.
Finding Equilibrium Price and Quantity
Given supply and demand functions, equilibrium is found by setting quantity supplied equal to quantity demanded:
Solving for price yields the equilibrium price, and substituting back gives equilibrium quantity.
Tabular Comparison: Demand vs. Supply Schedules
Price (per BTU) | Quantity Demanded (trillions of BTUs) | Quantity Supplied (trillions of BTUs) |
|---|---|---|
4.00 | 7.1 | 11.6 |
3.75 | 7.5 | 11.5 |
3.50 | 8.1 | 11.2 |
3.25 | 8.4 | 10.7 |
3.00 | 11.2 | 10.0 |
2.75 | 14.2 | 9.1 |
Additional info: The table above compares the demand and supply schedules for natural gas, illustrating how equilibrium is determined by the intersection of the two curves.
