 Back
BackChap 11 - Technology, Production, and Costs in Microeconomics
Study Guide - Smart Notes
 Tailored notes based on your materials, expanded with key definitions, examples, and context.
Technology, Production, and Costs
Technology: An Economic Definition
Technology in economics refers to the process by which firms use inputs—such as workers, machines, and natural resources—to produce outputs of goods and services. Technological change is any positive or negative change in a firm's ability to produce a given level of output with a given quantity of inputs.
Positive technological change: Improvements that allow more output from the same inputs (e.g., automation, better machinery).
Negative technological change: Events that reduce output from the same inputs (e.g., equipment breakdown).
Example: A restaurant adopting a new oven that bakes pizzas faster, increasing output with the same number of workers and ovens.
The Short Run and the Long Run in Economics
Economists distinguish between the short run and the long run based on the flexibility of input usage:
Short run: At least one input is fixed (e.g., capital such as ovens).
Long run: All inputs can be varied; firms can adopt new technology and change plant size.
The length of the long run varies by industry and firm.
Fixed, Variable, and Total Costs
Costs are categorized based on their behavior with respect to output:
Fixed costs (FC): Costs that remain constant as output changes (e.g., rent, equipment).
Variable costs (VC): Costs that change as output changes (e.g., wages, raw materials).
Total cost (TC): The sum of fixed and variable costs.
Formula:
Production Function and Example: Jill Johnson’s Restaurant
The production function describes the relationship between inputs employed and the maximum output produced. For example, Jill Johnson’s restaurant uses ovens (fixed input) and workers (variable input) to produce pizzas.
Quantity of Workers | Quantity of Ovens | Quantity of Pizzas | Cost of Ovens (FC) | Cost of Workers (VC) | Total Cost (TC) | Average Total Cost (ATC) |
|---|---|---|---|---|---|---|
0 | 2 | 0 | 800 | 0 | 800 | - |
1 | 2 | 200 | 800 | 650 | 1,450 | 7.25 |
2 | 2 | 450 | 800 | 1,300 | 2,100 | 4.67 |
3 | 2 | 550 | 800 | 1,950 | 2,750 | 5.00 |
4 | 2 | 600 | 800 | 2,600 | 3,400 | 5.67 |
5 | 2 | 625 | 800 | 3,250 | 4,050 | 6.48 |
6 | 2 | 640 | 800 | 3,900 | 4,700 | 7.34 |
Graphing Total Cost and Average Total Cost
Cost curves visually represent the relationship between output and costs. The total cost curve starts above zero due to fixed costs and rises as output increases. The average total cost (ATC) curve typically has a U-shape, reflecting economies and diseconomies of scale at different output levels.
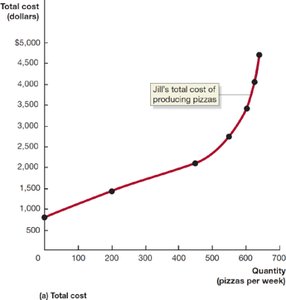
The Relationship Between Short-Run Production and Short-Run Cost
Key cost concepts in the short run include:
Average total cost (ATC):
Marginal cost (MC): The change in total cost from producing one more unit:
When MC is below ATC, ATC falls; when MC is above ATC, ATC rises. The same relationship holds for average variable cost (AVC).
Graphing Cost Curves: ATC, AVC, AFC, and MC
Dividing total costs by output gives:
Average total cost (ATC):
Average fixed cost (AFC):
Average variable cost (AVC):
Marginal cost (MC):
The ATC curve is the vertical sum of the AVC and AFC curves. As output increases, AFC declines, causing ATC and AVC to converge.
Costs in the Long Run
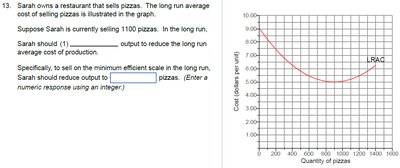
In the long run, all costs are variable. The long-run average cost (LRAC) curve shows the lowest possible cost of producing each output level when all inputs can be varied.
Economies of scale: LRAC falls as output increases (due to specialization, bulk buying, etc.).
Constant returns to scale: LRAC remains unchanged as output increases.
Diseconomies of scale: LRAC rises as output increases (due to management difficulties, inefficiencies).
Summary Table: Definitions of Cost
Term | Definition | Equation |
|---|---|---|
Total cost (TC) | Cost of all inputs used by a firm | |
Fixed costs (FC) | Costs that remain constant as output changes | - |
Variable costs (VC) | Costs that change as output changes | - |
Marginal cost (MC) | Increase in total cost from producing one more unit | |
Average total cost (ATC) | Total cost divided by quantity of output | |
Average fixed cost (AFC) | Fixed cost divided by quantity of output | |
Average variable cost (AVC) | Variable cost divided by quantity of output |
Additional info: The cost curves and definitions provided are foundational for understanding firm behavior in both the short run and long run. Mastery of these concepts is essential for analyzing production decisions, cost minimization, and the implications of scale in microeconomics.
