 Back
BackThe Costs of Production: Microeconomics Study Notes
Study Guide - Smart Notes
 Tailored notes based on your materials, expanded with key definitions, examples, and context.
The Costs of Production
Introduction
The study of production costs is central to understanding how firms make decisions about output and pricing in various market conditions. This topic explores the different types of costs, how they are measured, and their implications for firm behavior and market outcomes.
What are Costs?
Profit, Revenue, and Cost
Profit is defined as the difference between total revenue and total cost.
Total Revenue (TR) is the amount a firm receives from selling its output, calculated as price times quantity:
Total Cost (TC) is the market value of all inputs used in production.
Opportunity Costs
The cost of something is what you give up to get it (opportunity cost).
Firms' costs of production include all opportunity costs of making their output, both explicit and implicit.
Explicit and Implicit Costs
Explicit costs: Input costs that require an outlay of money by the firm (e.g., wages, rent).
Implicit costs: Input costs that do not require an outlay of money (e.g., foregone interest, owner’s time).
Total cost is the sum of explicit and implicit costs:
Economic Profit vs. Accounting Profit
Economic profit: Total revenue minus total cost (including both explicit and implicit costs).
Accounting profit: Total revenue minus explicit costs only.
Economic profit is usually less than accounting profit because it includes implicit costs.
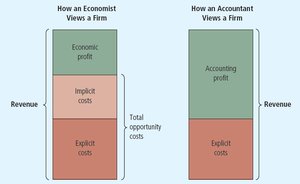
Figure: Economists include all opportunity costs (explicit and implicit) when analyzing a firm, while accountants consider only explicit costs. Thus, economic profit is smaller than accounting profit.
Production and Costs
The Production Function
The production function describes the relationship between the quantity of inputs used and the quantity of output produced. It typically gets flatter as production rises, reflecting diminishing marginal product.
Marginal product: The increase in output from an additional unit of input. It is the slope of the production function.
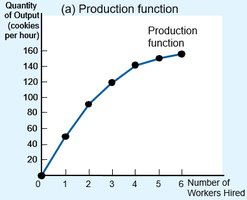
Figure: The production function shows output (cookies per hour) as a function of the number of workers hired. The curve flattens as more workers are added, illustrating diminishing marginal product.
Diminishing Marginal Product
Diminishing marginal product: As the quantity of an input increases, the marginal product of that input declines.
The production function becomes flatter as more inputs are used, indicating a decrease in the slope (marginal product).
Total-Cost Curve
The total-cost curve shows the relationship between the quantity produced and total costs.
It gets steeper as output increases due to diminishing marginal product—producing additional units becomes more costly.
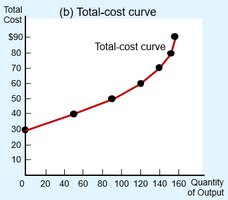
Figure: The total-cost curve for cookie production becomes steeper as output increases, reflecting higher costs due to diminishing marginal product.
The Various Measures of Cost
Fixed and Variable Costs
Fixed costs (FC): Costs that do not vary with the quantity of output produced (e.g., rent).
Variable costs (VC): Costs that vary with the quantity of output produced (e.g., raw materials).
Total cost (TC):
Average and Marginal Costs
Average fixed cost (AFC):
Average variable cost (AVC):
Average total cost (ATC):
Marginal cost (MC):
Cost Curves and Their Shapes
The marginal cost curve typically rises with output due to diminishing marginal product.
The average total cost curve is U-shaped: AFC declines as output rises, AVC typically rises due to diminishing marginal product.
The MC curve crosses the ATC curve at the minimum point of ATC (efficient scale).
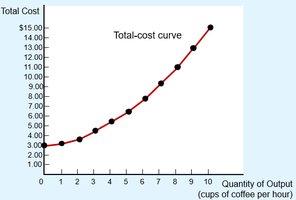
Figure: The total-cost curve for coffee production also becomes steeper as output increases, reflecting rising marginal costs.
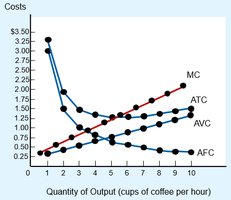
Figure: Cost curves for a coffee shop. Marginal cost (MC) rises with output, ATC is U-shaped, and MC crosses ATC at its minimum.
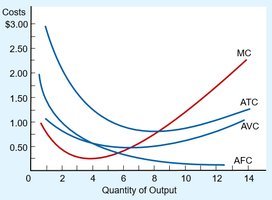
Figure: Typical cost curves for a firm. Notice the U-shape of ATC and AVC, and the upward slope of MC at higher output levels.
Efficient Scale and Cost Relationships
Efficient scale: The quantity of output that minimizes ATC.
When , ATC is falling; when , ATC is rising.
The MC curve always crosses the ATC curve at the minimum of ATC.
Costs in the Short Run and Long Run
Short Run vs. Long Run
In the short run, some costs are fixed; in the long run, all costs are variable.
Long-run cost curves are typically flatter than short-run cost curves, reflecting greater flexibility.
Short-run cost curves lie on or above the long-run cost curves.
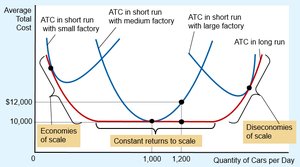
Figure: Short-run ATC curves for different factory sizes and the long-run ATC curve. The long-run curve is flatter and shows economies and diseconomies of scale.
Economies and Diseconomies of Scale
Economies of scale: Long-run ATC falls as output increases, often due to increased specialization.
Constant returns to scale: Long-run ATC remains constant as output changes.
Diseconomies of scale: Long-run ATC rises as output increases, often due to coordination problems.
Summary Table: Types of Cost
Type of Cost | Definition |
|---|---|
Explicit Cost | Requires a monetary outlay (e.g., wages, rent) |
Implicit Cost | No monetary outlay (e.g., foregone salary, interest) |
Fixed Cost (FC) | Does not vary with output |
Variable Cost (VC) | Varies with output |
Total Cost (TC) | FC + VC |
Average Fixed Cost (AFC) | FC divided by output |
Average Variable Cost (AVC) | VC divided by output |
Average Total Cost (ATC) | TC divided by output |
Marginal Cost (MC) | Change in TC divided by change in output |
Additional info: This summary table is inferred from the context and standard microeconomics textbooks to provide a comprehensive overview of cost types.
