 Back
BackChapter 3
Study Guide - Smart Notes
 Tailored notes based on your materials, expanded with key definitions, examples, and context.
Where Prices Come From: The Interaction of Demand and Supply
Introduction to Market Efficiency and Price Signals
In a market economy, prices play a crucial role in allocating scarce resources efficiently. When prices are allowed to fluctuate freely, they send signals to buyers and sellers, guiding them to allocate resources to their highest valued uses. Any interference with this process reduces market efficiency.
Perfectly Competitive Markets
Characteristics of Perfect Competition
Many buyers and sellers: No single participant can influence the market price.
Identical products: All firms sell homogeneous goods.
No barriers to entry: Firms can freely enter or exit the market.
This model serves as the foundation for understanding other market structures, such as monopolistic competition, oligopoly, and monopoly.
Demand Side of the Market
Understanding Demand
Demand reflects both the desire and the ability to purchase goods or services. The law of demand states that, ceteris paribus, as the price of a good decreases, the quantity demanded increases, and vice versa. This inverse relationship is due to the substitution and income effects.
Substitution Effect: When the price of a good falls, it becomes relatively cheaper compared to substitutes, increasing its quantity demanded.
Income Effect: A lower price increases consumers' purchasing power, allowing them to buy more.
Example: If gasoline drops from $3.50 to $1.00 per gallon, consumers are likely to buy more gas due to both effects.
Demand Schedule and Curve
A demand schedule is a table showing the relationship between price and quantity demanded. The demand curve is a graphical representation, typically downward sloping due to the law of demand.
Price | Quantity Demanded |
|---|---|
$1,000 | 100 |
800 | 150 |
600 | 200 |
400 | 250 |
200 | 300 |
Market Demand is the total demand from all consumers in a specific market.
Movements vs. Shifts in Demand
It is essential to distinguish between a change in quantity demanded (movement along the curve due to price changes) and a change in demand (shift of the curve due to other factors).
Change in Quantity Demanded: Caused by a change in the good's price; represented as movement along the demand curve.
Change in Demand: Caused by changes in non-price factors; represented as a shift of the demand curve.
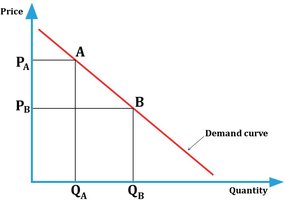
Example: If price decreases from to , quantity demanded increases from to (movement along the curve).
Determinants (Shifters) of Demand
There are five main factors that can shift the demand curve (acronym: PIPET):
Price of Related Goods: Substitutes (positive relationship) and complements (negative relationship).
Income: Normal goods (demand rises with income) vs. inferior goods (demand falls with income).
Population and Demographics: More consumers increase demand.
Expected Future Prices: If prices are expected to rise, current demand increases.
Tastes and Preferences: Changes in consumer preferences can shift demand.
Example: If the price of pencils rises, demand for pens (a substitute) increases.
Supply Side of the Market
Understanding Supply
The law of supply states that, ceteris paribus, as the price of a good increases, the quantity supplied increases, and vice versa. This positive relationship is due to the incentive of higher profits at higher prices.
Supply Schedule and Curve
A supply schedule is a table showing the relationship between price and quantity supplied. The supply curve is a graphical representation, typically upward sloping due to the law of supply.
Price | Quantity Supplied |
|---|---|
$200 | 100 |
400 | 150 |
600 | 200 |
800 | 250 |
1,000 | 300 |
Market Supply is the total supply from all firms in a specific market.
Movements vs. Shifts in Supply
It is important to distinguish between a change in quantity supplied (movement along the curve due to price changes) and a change in supply (shift of the curve due to other factors).
Change in Quantity Supplied: Caused by a change in the good's price; represented as movement along the supply curve.
Change in Supply: Caused by changes in non-price factors; represented as a shift of the supply curve.
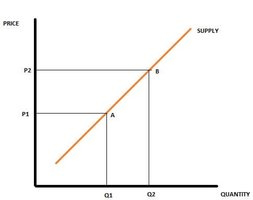
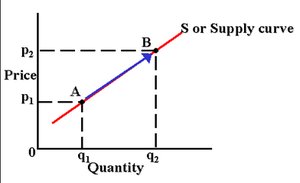
Example: If price increases from to , quantity supplied increases from to (movement along the curve).
Determinants (Shifters) of Supply
There are five main factors that can shift the supply curve (acronym: PPENT):
Price of Inputs: Higher input prices decrease supply (shift left); lower input prices increase supply (shift right).
Price of Substitutes in Production: If the price of a substitute rises, supply of the original good may decrease.
Expected Future Prices: If prices are expected to rise, current supply decreases.
Number of Firms: More firms increase supply.
Technological Changes: Positive changes increase supply; negative changes decrease supply.
Example: If the price of steel (input) rises, supply of locomotives decreases.
Market Equilibrium
Equilibrium Price and Quantity
Market equilibrium occurs where the quantity demanded equals the quantity supplied at a specific price. At this point, there is no pressure for price to change, and the maximum number of buyers and sellers are satisfied.
Surplus: Occurs when price is above equilibrium; quantity supplied exceeds quantity demanded, leading to downward pressure on price.
Shortage: Occurs when price is below equilibrium; quantity demanded exceeds quantity supplied, leading to upward pressure on price.
Changes in Equilibrium
Shifts in demand or supply cause the equilibrium price and quantity to change:
Increase in Demand: Higher equilibrium price and quantity.
Decrease in Demand: Lower equilibrium price and quantity.
Increase in Supply: Lower equilibrium price, higher equilibrium quantity.
Decrease in Supply: Higher equilibrium price, lower equilibrium quantity.
Simultaneous shifts in supply and demand require careful analysis to determine the net effect on equilibrium price and quantity.
Summary Table: Demand and Supply Shifters
Demand Shifter | Effect on Demand |
|---|---|
Price of Related Goods (Substitutes) | Price up: Demand up; Price down: Demand down |
Price of Related Goods (Complements) | Price up: Demand down; Price down: Demand up |
Income (Normal Goods) | Income up: Demand up; Income down: Demand down |
Income (Inferior Goods) | Income up: Demand down; Income down: Demand up |
Population | Population up: Demand up; Population down: Demand down |
Expected Future Prices | Expected price up: Demand up; Expected price down: Demand down |
Tastes/Preferences | Tastes up: Demand up; Tastes down: Demand down |
Supply Shifter | Effect on Supply |
|---|---|
Price of Inputs | Input price up: Supply down; Input price down: Supply up |
Price of Substitutes in Production | Substitute price up: Supply down; Substitute price down: Supply up |
Expected Future Prices | Expected price up: Supply down; Expected price down: Supply up |
Number of Firms | Firms up: Supply up; Firms down: Supply down |
Technological Changes | Positive: Supply up; Negative: Supply down |
Key Equations
Law of Demand: (holding all else constant, as increases, decreases)
Law of Supply: (holding all else constant, as increases, increases)
Market Equilibrium: at equilibrium price
Practice Questions
Why must prices be allowed to freely fluctuate for efficient resource allocation?
True or False: Changes in variables other than price cause movements along the supply/demand curve.
If a freeze decreases the supply of oranges and raises their price, what happens to the demand for apples? What is the new equilibrium price and quantity for apples?
True or False: The first result of a decrease in demand is a shortage.
What is the economic term for the inverse relationship between income and demand?
Explain why an increase in the price of hoodies (a substitute in production for t-shirts) decreases the supply of t-shirts.
When the price of an input increases and supply decreases, what must happen to prices to eliminate the resulting shortage?
What occurs in the market when price is below equilibrium, and what must happen to eliminate it?
What occurs in the market when price is above equilibrium, and what must happen to eliminate it?
What happens to equilibrium price and quantity when demand shifts right?
What happens to equilibrium price and quantity when demand shifts left?
What happens to equilibrium price and quantity when supply shifts right?
What happens to equilibrium price and quantity when supply shifts left?
How must each of the five demand shifters change to shift the demand curve right?
How must each of the five supply shifters change to shift the supply curve left?
