 Back
BackUncertainty and Risk in Microeconomics
Study Guide - Smart Notes
 Tailored notes based on your materials, expanded with key definitions, examples, and context.
Uncertainty and Risk
Introduction to Uncertainty
Many economic decisions are made under conditions of uncertainty, where outcomes are not known with certainty in advance. Individuals and firms must evaluate risky alternatives and make choices that reflect their preferences toward risk.
Uncertainty refers to situations where the probabilities of possible outcomes are unknown or not well defined.
Risk involves situations where the probabilities of different outcomes are known or can be estimated.
Examples include investment decisions, insurance purchases, and career choices.
Describing Risk
Risk can be quantified using concepts such as expected value, variance, and standard deviation.
Expected Value (EV): The probability-weighted average of all possible outcomes.
Variance: Measures the dispersion of possible outcomes around the expected value.
Standard Deviation: The square root of variance, representing the average deviation from the expected value.
Example: If a vineyard earns $100,000 in good weather (probability 0.6) and loses $20,000 in poor weather (probability 0.4):
Expected Value:
Variance:
Risk Preferences
Individuals differ in their attitudes toward risk, which can be classified as risk averse, risk neutral, or risk loving.
Risk Averse: Prefers a certain outcome over a gamble with the same expected value. Characterized by diminishing marginal utility of income.
Risk Neutral: Indifferent between a certain outcome and a gamble with the same expected value. Marginal utility of income is constant.
Risk Loving: Prefers a gamble over a certain outcome with the same expected value. Marginal utility of income increases with income.
Example: Wealthy individuals may be more willing to take risks, while those with less wealth may be more risk averse. People are also more likely to take risks when the stakes are low.
Maximizing Expected Utility
Consumers make choices to maximize their expected utility, which is the probability-weighted sum of the utilities of all possible outcomes.
Expected Utility (EU): , where is the probability of outcome and is the utility of that outcome.
Consumers may not always maximize expected utility if they cannot assign probabilities or utilities to all outcomes, especially for rare or extreme events.
Example: A risk averse person may avoid a gamble even if the expected value is positive, due to the pain of potential loss.
Insurance and Risk Reduction
Insurance allows risk averse individuals to transfer risk to insurers, often paying more than the expected value of the loss for peace of mind.
Risk averse individuals are willing to pay a premium above the expected loss to avoid large, unlikely losses.
Insurance companies, by pooling many risks, behave as if they are risk neutral due to the law of large numbers.
Example: A homeowner may pay $400 for insurance against a $200 expected loss because the disutility of losing their house is much greater than the premium paid.
Value of Information
Obtaining additional information is valuable if it leads to better decisions and increases expected utility, after accounting for the cost of the information.
Information is worth acquiring if it changes the choice and increases the expected utility net of information costs.
Behavioral Economics and Reference Points
Behavioral economics examines how psychological factors and reference points affect decision-making under uncertainty.
Endowment Effect: Individuals value goods more once they own them, leading to inconsistent buying and selling behavior.
Reference points can shift, changing willingness to pay or accept for the same good.
Example: A consumer may refuse to sell a shirt for $50 after buying it for $25, even though they would not have paid $50 to buy it initially.
Applications and Problem Solving
Microeconomic analysis of uncertainty is applied to investment decisions, insurance pricing, and risk management in firms and households.
Expected value and variance calculations guide investment and insurance choices.
Risk premiums measure the amount individuals are willing to pay to avoid risk.
Adverse selection and moral hazard are important considerations in insurance markets.
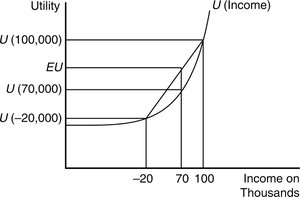
Graphical Illustration: Utility and Risk Attitudes
The shape of the utility function over income illustrates risk preferences. A concave utility function indicates risk aversion, while a convex function indicates risk loving behavior. The diagram below shows the utility levels associated with different income outcomes and the expected utility for a risky prospect versus a certain outcome.
Summary Table: Risk Preferences and Utility Functions
Risk Preference | Utility Function Shape | Decision Example |
|---|---|---|
Risk Averse | Concave | Prefers certain $50 over 50% chance at $100 |
Risk Neutral | Linear | Indifferent between certain $50 and 50% chance at $100 |
Risk Loving | Convex | Prefers 50% chance at $100 over certain $50 |
Key Formulas
Expected Value:
Variance:
Expected Utility:
Additional Info
As individuals age, they typically become more risk averse, shifting investments toward lower-risk assets.
Adverse selection occurs when insurers cannot distinguish between high- and low-risk clients, leading to higher premiums for all.
Employers balance the cost of risk reduction with wage differentials to attract workers with different risk preferences.
