 Back
BackWhere Prices Come From: The Interaction of Demand and Supply
Study Guide - Smart Notes
 Tailored notes based on your materials, expanded with key definitions, examples, and context.
Chapter 3: Where Prices Come From – The Interaction of Demand and Supply
Perfectly Competitive Markets
A perfectly competitive market is defined by three main conditions: (1) many buyers and sellers, (2) all firms selling identical products, and (3) no barriers to new firms entering the market. These conditions ensure that no single buyer or seller can influence the market price, and resources are allocated efficiently.
The Demand Side of the Market
Demand Schedules and Demand Curves
Consumers determine which goods and services are produced, with price being the primary factor in their purchasing decisions.
Demand Schedule: A table showing the relationship between the price of a product and the quantity demanded.
Quantity Demanded: The amount of a good or service that a consumer is willing and able to purchase at a given price.
Demand Curve: A graphical representation showing the relationship between the price of a product and the quantity demanded by all consumers (market demand).
The Law of Demand
The Law of Demand states that, holding everything else constant, when the price of a product falls, the quantity demanded increases, and when the price rises, the quantity demanded decreases.
Substitution Effect: When the price of a good falls, it becomes less expensive relative to other goods, leading consumers to substitute it for other goods.
Income Effect: A lower price increases consumers' purchasing power, allowing them to buy more of the good.
Ceteris Paribus Condition: The requirement that all other variables are held constant when analyzing the relationship between price and quantity demanded.
Variables That Shift Market Demand
Income:
Normal Good: Demand increases as income rises.
Inferior Good: Demand increases as income falls.
Prices of Related Goods:
Substitutes: Goods used for the same purpose. A decrease in the price of a substitute shifts demand left; an increase shifts it right.
Complements: Goods used together. A decrease in the price of a complement shifts demand right; an increase shifts it left.
Tastes: Changes in consumer preferences can shift demand.
Population and Demographics: Increases in population or changes in demographic characteristics can increase or decrease demand for specific goods.
Expected Future Prices: If consumers expect lower future prices, current demand decreases; if higher, current demand increases.
Natural Disasters and Pandemics: Typically shift demand left due to reduced economic activity.
Change in Demand vs. Change in Quantity Demanded
Change in Demand: A shift of the demand curve due to changes in non-price variables.
Change in Quantity Demanded: A movement along the demand curve due to a change in the product's price.
The Supply Side of the Market
Supply Schedules and Supply Curves
Firms' willingness and ability to supply goods are influenced by several variables, with price being the most important.
Quantity Supplied: The amount of a good or service that a firm is willing and able to supply at a given price.
Supply Schedule: A table showing the relationship between the price of a product and the quantity supplied.
Supply Curve: A graphical representation showing the relationship between the price of a product and the quantity supplied.
The Law of Supply
The Law of Supply states that, holding everything else constant, increases in price cause increases in the quantity supplied, and decreases in price cause decreases in the quantity supplied.
Movements along the supply curve are caused by changes in the product's price.
Shifts of the supply curve are caused by changes in other variables affecting supply.
Variables That Shift Market Supply
Prices of Inputs: Higher input prices increase production costs and shift supply left; lower input prices shift supply right.
Technological Change: Positive changes increase productivity and shift supply right; negative changes shift supply left.
Prices of Related Goods in Production:
Substitutes in Production: If the price of one good rises, firms may shift production toward it, reducing supply of the other good.
Complements in Production: If the price of one good rises, supply of both goods may increase.
Number of Firms: Entry of new firms shifts supply right; exit shifts it left.
Expected Future Prices: If firms expect higher future prices, they may decrease current supply.
Natural Disasters and Pandemics: Typically reduce supply, shifting the curve left.
Change in Supply vs. Change in Quantity Supplied
Change in Supply: A shift of the supply curve due to changes in non-price variables.
Change in Quantity Supplied: A movement along the supply curve due to a change in the product's price.
Market Equilibrium: Putting Demand and Supply Together
Market Equilibrium
Market equilibrium occurs when quantity demanded equals quantity supplied. In a competitive market equilibrium, many buyers and sellers interact, and the equilibrium price is determined by the intersection of the demand and supply curves. Neither consumers nor firms can dictate the equilibrium price independently.
The Effect of Demand and Supply Shifts on Equilibrium
The Effect of Shifts in Demand on Equilibrium
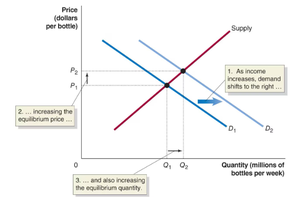
When demand increases (e.g., due to higher income), the demand curve shifts right, causing a shortage at the original equilibrium price. The equilibrium price and quantity both rise as the market adjusts.
If the price of a substitute falls, demand decreases, shifting the demand curve left, and both equilibrium price and quantity decrease.
The Effects of Shifts in Supply on Equilibrium
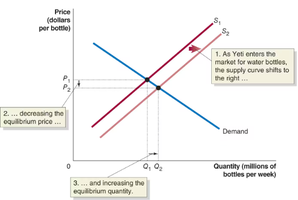
When supply increases (e.g., a new firm enters the market), the supply curve shifts right, causing a surplus at the original equilibrium price. The equilibrium price falls, and the equilibrium quantity rises as the market adjusts.
If a firm exits the market, the supply curve shifts left, causing the equilibrium price to rise and the equilibrium quantity to fall.
The Effect of Shifts in Demand and Supply Over Time
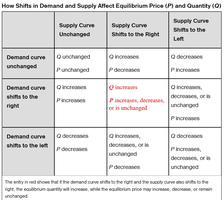
Demand and supply curves are constantly shifting due to changes in underlying variables, causing equilibrium prices and quantities to change over time. The combined effects of shifts in both curves can be summarized as follows:
Shifts in a Curve vs. Movements Along a Curve
A shift in the demand or supply curve changes equilibrium price and quantity, but the resulting price change does not cause a further shift in the same curve.
For demand or supply to change, the entire curve must shift due to a non-price variable, not just a movement along the curve caused by a price change.
Key Equations
Market Equilibrium Condition:
Demand Function (linear):
Supply Function (linear):
Equilibrium Price:
Equilibrium Quantity:
Example: If the demand for water bottles increases due to higher income, the demand curve shifts right, raising both equilibrium price and quantity. If a new firm enters the market, the supply curve shifts right, lowering equilibrium price and increasing equilibrium quantity.
