Skip to main content
Physics
My Course
Learn
Exam Prep
AI Tutor
Study Guides
Textbook Solutions
Flashcards
Explore
Try the app
My Course
Learn
Exam Prep
AI Tutor
Study Guides
Textbook Solutions
Flashcards
Explore
Try the app
Back
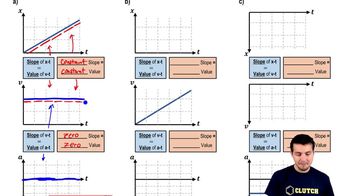
Graphing Position, Velocity, and Acceleration Graphs definitions
You can tap to flip the card.
Position-Time Graph
You can tap to flip the card.
👆
Position-Time Graph
A graph that shows how position changes over time, with the slope representing velocity.
Track progress
Control buttons has been changed to "navigation" mode.
1/15
Related flashcards
Related practice
Recommended videos
Graphing Position, Velocity, and Acceleration Graphs quiz
Graphing Position, Velocity, and Acceleration Graphs
24 Terms
Graphing Position, Velocity, and Acceleration Graphs quiz #1
Graphing Position, Velocity, and Acceleration Graphs
12 Terms
Graphing Position, Velocity, and Acceleration Graphs
2. 1D Motion / Kinematics
2 problems
Topic
Emilee
2. 1D Motion / Kinematics - Part 1 of 2
7 topics
14 problems
Chapter
Patrick
2. 1D Motion / Kinematics - Part 2 of 2
5 topics
11 problems
Chapter
Patrick
Guided course
07:32
Graphing Position, Velocity, and Acceleration Graphs
11656
views
180
rank
4
comments
Guided course
03:35
Graph Velocity and Acceleration
7500
views
199
rank
3
comments
Terms in this set (15)
Hide definitions
Position-Time Graph
A graph that shows how position changes over time, with the slope representing velocity.
Velocity-Time Graph
A graph depicting how velocity changes over time, where the slope indicates acceleration.
Acceleration
The rate of change of velocity over time, often represented as the slope of a velocity-time graph.
Constant Slope
A straight line on a graph indicating a uniform rate of change, such as constant velocity or acceleration.
Flat Line
A horizontal line on a graph indicating no change in the variable, such as zero acceleration.
Curved Line
A line on a graph that indicates a changing rate of change, such as increasing or decreasing velocity.
Negative Acceleration
A decrease in velocity over time, often shown as a downward slope on a velocity-time graph.
Origin
The starting point on a graph, typically where position and velocity are zero.
Constant Velocity
A steady speed in a straight line, represented by a flat line on a velocity-time graph.
Decreasing Slope
A slope that becomes less steep over time, indicating a reduction in velocity.
Increasing Slope
A slope that becomes steeper over time, indicating an increase in velocity.
Motion Variables
The three key components of motion: position, velocity, and acceleration.
Sketch
A rough drawing representing the main features of a graph without precise measurements.
Frowny Face Curve
A downward curving line on a position graph, indicating negative acceleration.
Smiley Face Curve
An upward curving line on a position graph, indicating positive acceleration.
 BackBack

 07:32
07:32