How can you identify a graph that represents an object with zero acceleration using position, velocity, and acceleration graphs?
An object with zero acceleration will have a velocity-time graph that is a flat, horizontal line (constant velocity), and its acceleration-time graph will be a flat line at zero. The position-time graph will be a straight line with constant slope.
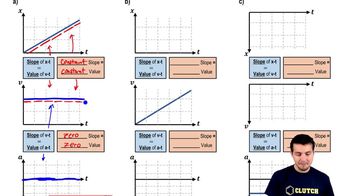
What features make a set of position, velocity, and acceleration graphs consistent with each other in describing an object's motion?
A consistent set of motion graphs will have the following relationships: the slope of the position-time graph equals the value of the velocity-time graph; the slope of the velocity-time graph equals the value of the acceleration-time graph. For example, a position graph with constant slope matches a velocity graph with a flat line, and an acceleration graph at zero.
Describe the general shape of the output graph from an AC voltage source and relate it to motion graphs discussed in the topic.
The output graph from an AC voltage source is typically a sinusoidal (wave-like) curve, similar to a position-time graph for an object undergoing simple harmonic motion, where the value oscillates periodically above and below zero.
What would the acceleration-time graph look like for a bicycle moving over the interval 0 s ≤ t ≤ 4 s if its velocity is constant during this time?
If the bicycle's velocity is constant from 0 s to 4 s, the acceleration-time graph will be a flat line at zero, indicating zero acceleration throughout the interval.
What does a curved position-time graph indicate about the object's velocity and acceleration?
A curved position-time graph indicates that the object's velocity is changing, meaning there is acceleration. The curvature direction shows whether the acceleration is positive (upward curve) or negative (downward curve).
If the velocity-time graph shows a straight line with a positive constant slope, what does the corresponding acceleration-time graph look like?
The acceleration-time graph will be a flat, horizontal line above zero, indicating constant positive acceleration. This is because the slope of the velocity-time graph equals the value of acceleration.
How do you determine the starting point for sketching position or velocity graphs when given acceleration or velocity graphs?
You use the initial conditions provided, such as starting from rest or from the origin. If not specified, you typically assume the object starts at zero position or velocity for sketching purposes.
What does a negative constant value on the acceleration-time graph imply about the shape and direction of the velocity-time graph?
A negative constant acceleration means the velocity-time graph will be a straight line sloping downward. This indicates the object's velocity is decreasing over time.
When sketching a position-time graph from a velocity-time graph with increasing values, what feature should the position graph have?
The position-time graph should be a curve with an increasing slope, reflecting that the object's velocity is increasing. This results in a position graph that curves upward.
Why is it unnecessary to use equations when sketching motion graphs from one another in these problems?
It is unnecessary because the relationships between the graphs rely on understanding slopes and values, not precise calculations. Sketching focuses on the general shape and trends rather than exact numbers.
How can you determine acceleration from a position-time graph?
To determine acceleration from a position-time graph, first find the slope of the position-time graph at each point to obtain the velocity as a function of time. Then, find the slope of the resulting velocity-time graph; this slope gives the acceleration. In summary, acceleration is the second derivative of position with respect to time.
What steps are involved in finding acceleration using a position-time graph?
To find acceleration from a position-time graph, first calculate the slope of the position-time graph to get the velocity at each point. Next, plot these velocity values versus time to create a velocity-time graph. Finally, determine the slope of the velocity-time graph, which represents the acceleration.
 Back
Back

 07:32
07:32