 Back
BackAnalyzing a Piecewise Function and Its Range
Study Guide - Smart Notes
 Tailored notes based on your materials, expanded with key definitions, examples, and context.
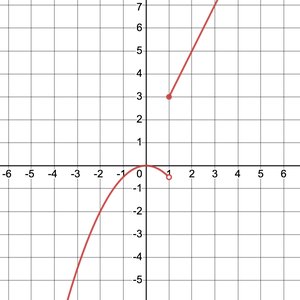
Q1. Sketch the graph of the piecewise function:
\[ f(x) = \begin{cases} -\frac{1}{2}x^2 & \text{if } x < 1 \\ 2x + 1 & \text{if } x \geq 1 \end{cases} \]
Then, use the graph of to determine its range.
Background
Topic: Piecewise Functions and Range
This question tests your understanding of how to interpret and graph piecewise-defined functions, and how to use the graph to determine the range of the function.
Key Terms and Formulas
Piecewise Function: A function defined by different expressions depending on the input value ().
Range: The set of all possible output values () of a function.
Step-by-Step Guidance
Identify the two pieces of the function and their domains:
For , (a downward-opening parabola, left of ).
For , (a straight line, starting at and continuing right).
Sketch each piece on the coordinate plane:
For , plot the parabola up to but not including .
For , plot the line starting at (including $x=1$).
Check the value of each piece at the transition point :
Calculate for both pieces to see if the graph is continuous at or if there is a jump.
Use the graph to determine the lowest and highest -values for each piece, and look for any gaps in the range.
Combine the -values from both pieces to describe the overall range of .
Try solving on your own before revealing the answer!
Final Answer:
The range of is .
The parabola covers all -values up to $0), and the line starts at and increases without bound.
