 Back
BackAnalyzing Absolute and Local Extrema from Graphs
Study Guide - Smart Notes
 Tailored notes based on your materials, expanded with key definitions, examples, and context.
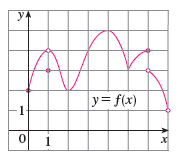
Q7. Use the graph to state the absolute and local maximum and minimum values of the function.
Background
Topic: Extrema of Functions (Absolute and Local Maxima/Minima)
This question is testing your ability to interpret a graph and identify the highest and lowest points (maxima and minima) on the graph, both locally (in a small neighborhood) and absolutely (over the entire domain shown).
Key Terms:
Absolute Maximum: The highest point on the graph over the entire interval shown.
Absolute Minimum: The lowest point on the graph over the entire interval shown.
Local Maximum: A point higher than all nearby points, but not necessarily the highest overall.
Local Minimum: A point lower than all nearby points, but not necessarily the lowest overall.
Step-by-Step Guidance
Examine the graph and identify all the peaks (high points) and valleys (low points). These are candidates for local maxima and minima.
For each peak, check if it is the highest point on the entire graph. If so, it is the absolute maximum. If not, but it is higher than points immediately to its left and right, it is a local maximum.
For each valley, check if it is the lowest point on the entire graph. If so, it is the absolute minimum. If not, but it is lower than points immediately to its left and right, it is a local minimum.
Be sure to check endpoints (the leftmost and rightmost points) as possible locations for absolute extrema, especially if the graph is closed or open at those points.
List the x-values (and corresponding y-values) where these extrema occur. Clearly distinguish between local and absolute extrema.
Try solving on your own before revealing the answer!
