 Back
BackAnalyzing Features of a Piecewise Function Graph
Study Guide - Smart Notes
 Tailored notes based on your materials, expanded with key definitions, examples, and context.
Q1. Analyze the features of the given function graph:
Identify all local maxima and minima.
Find all x-intercepts and y-intercepts.
State the domain and range using interval notation.
List the intervals where and .
List the intervals where is increasing and where it is decreasing.
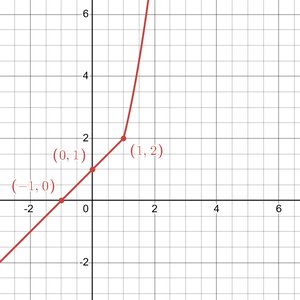
Background
Topic: Features of Functions (Graph Analysis)
This question tests your ability to interpret a function's graph and identify key features such as intercepts, extrema (maxima and minima), domain, range, and intervals of positivity/negativity and monotonicity (increasing/decreasing behavior).
Key Terms and Formulas
Local Maximum: A point where the function changes from increasing to decreasing, and is higher than nearby points.
Local Minimum: A point where the function changes from decreasing to increasing, and is lower than nearby points.
x-intercept: Where the graph crosses the x-axis ().
y-intercept: Where the graph crosses the y-axis ().
Domain: All possible -values for which the function is defined.
Range: All possible -values the function attains.
Intervals of Increase/Decrease: Where the function is going up or down as increases.
Intervals where or : Where the graph is above or below the x-axis.
Step-by-Step Guidance
Examine the graph to identify any local maxima or minima. Look for points where the graph changes direction (from increasing to decreasing or vice versa).
Find the x-intercept(s) by locating where the graph crosses the x-axis. Write the x-value(s) where .
Find the y-intercept by identifying where the graph crosses the y-axis (). Record the corresponding value.
Determine the domain by observing the leftmost and rightmost points on the graph. State the interval of -values for which the graph exists.
Determine the range by finding the lowest and highest -values the graph attains. State the interval of $y$-values covered by the graph.
Identify the intervals where (graph above the x-axis) and (graph below the x-axis). Use interval notation.
Analyze where the function is increasing (slopes upward as increases) and where it is decreasing (slopes downward as $x$ increases). State these intervals in terms of $x$.
Try solving on your own before revealing the answer!
Final Answer:
Local maxima: none
Local minima: none
x-intercept(s):
y-intercept:
Domain:
Range:
Interval(s) where :
Interval(s) where :
Increasing:
Decreasing: none
The graph is always increasing, has no local maxima or minima, and crosses the x-axis at and the y-axis at . The function is positive for and negative for .
