 Back
BackAnalyzing Graphs to Determine if They Represent Functions
Study Guide - Smart Notes
 Tailored notes based on your materials, expanded with key definitions, examples, and context.
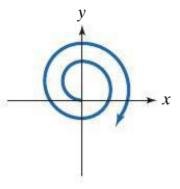
Q6. Determine if the graph represents the graph of a function.
Background
Topic: Functions and Graphs
This question tests your understanding of what qualifies as a function in mathematics, specifically by analyzing graphs. A function is a relation in which each input (x-value) corresponds to exactly one output (y-value).
Key Terms and Concepts:
Function: A relation where each input has only one output.
Vertical Line Test: A graphical method to determine if a curve is a function. If any vertical line crosses the graph more than once, the graph does not represent a function.
Step-by-Step Guidance
Examine the graph carefully and imagine drawing vertical lines at various points along the x-axis.
For each vertical line, check if it intersects the graph at more than one point. If it does, the graph fails the vertical line test and is not a function.
If every vertical line intersects the graph at most once, then the graph passes the vertical line test and represents a function.
Pay attention to open and closed circles, which indicate whether endpoints are included or excluded. This can affect whether the graph is a function at those points.
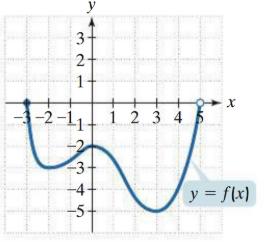
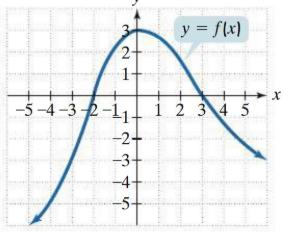
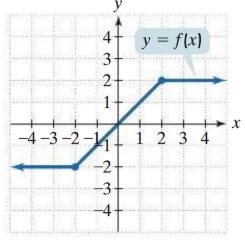
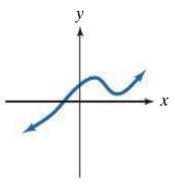
Try solving on your own before revealing the answer!
Final Answer:
Graphs 1, 2, 3, and 4 represent functions because they pass the vertical line test. Graph 5 does not represent a function because some vertical lines intersect the spiral at multiple points.
The vertical line test is a quick way to check if a graph is a function: if any vertical line crosses the graph more than once, it is not a function.
