 Back
Basics of Functions and Their Graphs
Study Guide - Smart Notes
 Tailored notes based on your materials, expanded with key definitions, examples, and context.
Basics of Functions and Their Graphs
Definitions: Relation, Domain, and Range
A relation is any set of ordered pairs. The domain of a relation is the set of all first components (inputs), and the range is the set of all second components (outputs).
Domain: All possible input values (usually x-values).
Range: All possible output values (usually y-values).
Relations can be represented in various forms: tables, graphs, mappings, or sets of points.
Example Representations:
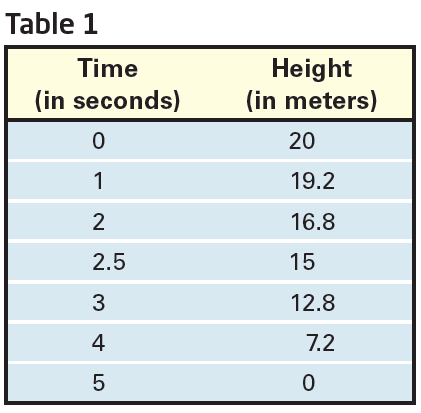
Table: Shows pairs of input and output values.
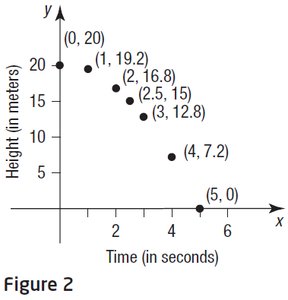
Graph: Plots the ordered pairs on a coordinate plane.
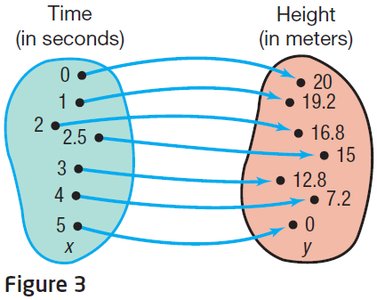
Mapping: Illustrates how each input is paired with an output.
Set of Points: Example: {(0, 187), (1, 212), (2, 225), (3, 238)}
Definition: Function
A function is a special type of relation in which each element of the domain corresponds to exactly one element in the range. In other words, for every input, there is only one output.
Function Notation: denotes the value of the function at .
Example: The set {(1, 2), (3, 4), (6, 5), (8, 5)} is a function because each input has only one output.
Non-Example: The equation does not represent as a function of because some $x$-values correspond to two $y$-values.
Evaluating a Function
To evaluate a function, substitute the given input value into the function's formula.
Example: Given , evaluate :
Graphing Functions by Plotting Points
To graph a function, select several input values, compute the corresponding outputs, and plot the resulting points on the coordinate plane. Connect the points if the function is continuous.
Example: Graph and for . The graph of is the graph of shifted downward by 3 units.
Equation vs Expression
Equation: A mathematical statement where two expressions are set equal to each other (e.g., ).
Expression: A mathematical phrase that does not include an equality sign (e.g., ).
Vertical Line Test for Functions
The vertical line test is used to determine if a graph represents a function. If any vertical line intersects the graph more than once, the graph does not represent a function.
Obtaining Information from a Function's Graph
You can extract valuable information from a function's graph, such as the value of the function at a specific input, or for which inputs the function attains a certain output.
Example: If , then at , the output is 400.
To find such that , look for $x$-values where the graph reaches a height of 100.
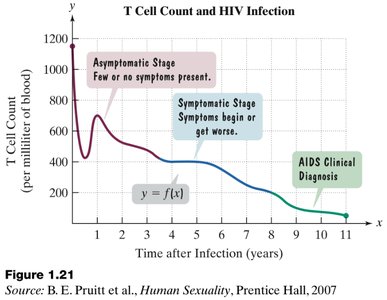
Identifying Domain and Range from a Function’s Graph
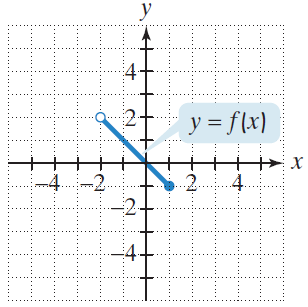
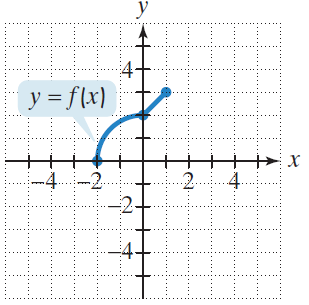
To find the domain from a graph, look for all -values (inputs) that correspond to points on the graph. To find the range, look for all -values (outputs) that correspond to points on the graph.
Interval Notation: Used to describe continuous sets of numbers, e.g., (closed interval), (open interval).
Set Notation: Describes the set of all such that .
Identifying Intercepts from a Function’s Graph
The x-intercepts are the points where the graph crosses the -axis (i.e., where ). The y-intercept is the point where the graph crosses the -axis (i.e., where ). A function can have multiple -intercepts but at most one $y$-intercept.
Example: For a function , if the graph crosses the -axis at and the -axis at , then the $x$-intercepts are $x = -1, 2, 3$ and the $y$-intercept is $y = -6$.
Summary Table: Representations of a Relation
Representation | Description | Example |
|---|---|---|
Table | Lists input-output pairs | See Table 1 above |
Graph | Plots points on coordinate axes | See Figure 2 above |
Mapping | Shows correspondence between sets | See Figure 3 above |
Set of Points | Explicitly lists ordered pairs | {(0, 20), (1, 19.2), ...} |
