 Back
Change in Tandem: Graphical Behavior and Rate of Change in Functions
Study Guide - Smart Notes
 Tailored notes based on your materials, expanded with key definitions, examples, and context.
Functions and Their Representations
Definition and Key Concepts
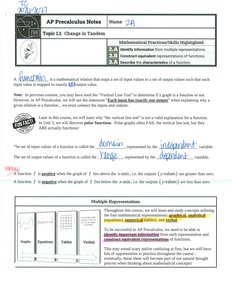
A function is a mathematical relation where each input value is assigned to exactly one output value. Functions are fundamental in precalculus, as they model relationships between variables and allow us to analyze how changes in one variable affect another.
Domain: The set of all possible input values (independent variable).
Range: The set of all possible output values (dependent variable).
Notation: Functions are often written as f(x), where x is the input and f(x) is the output.
Multiple representations of functions include graphs, tables, equations, and verbal descriptions. Understanding these forms is essential for interpreting and analyzing functions in precalculus.
Graphical Behavior of Functions
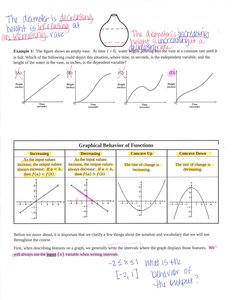
Increasing, Decreasing, and Constant Functions
The graphical behavior of a function describes how the output values change as the input values increase. This behavior is classified as increasing, decreasing, or constant over specific intervals.
Increasing: A function is increasing on an interval if, as the input increases, the output also increases.
Decreasing: A function is decreasing on an interval if, as the input increases, the output decreases.
Constant: A function is constant on an interval if the output remains unchanged as the input increases.
These behaviors can be visually identified on a graph by observing the slope of the function over the interval.
Concavity: Concave Up and Concave Down
Concavity describes the curvature of a function's graph. A function is concave up if its graph bends upwards, and concave down if it bends downwards. Concavity is closely related to the rate of change of the function.
Concave Up: The rate of change (slope) is increasing; the graph appears to bend upwards.
Concave Down: The rate of change (slope) is decreasing; the graph appears to bend downwards.
Concavity is important for understanding the behavior of functions and predicting their future values.
Rate of Change
Definition and Interpretation
The rate of change of a function measures how quickly the output values change with respect to the input values. It is often represented as the slope of the function's graph.
Positive Rate of Change: The function is increasing.
Negative Rate of Change: The function is decreasing.
Zero Rate of Change: The function is constant.
Understanding the rate of change is essential for analyzing real-world phenomena, such as velocity, growth, and decay.
Examples and Applications
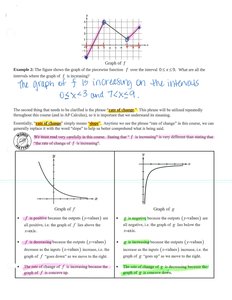
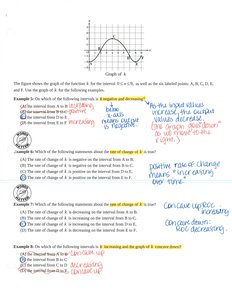
Consider the graph of a function f over the interval [0, 9]. To determine where the function is increasing, decreasing, or constant, observe the slope of the graph:
The graph of f is increasing on the intervals 0 < x < 3 and 7 < x < 9.
The graph of f is decreasing on the interval 3 < x < 7.
Concavity can also be analyzed by observing the curvature of the graph. For example, if the graph is concave down, the rate of change is decreasing.
Graphical Analysis and AP Exam Tips
Analyzing Graphs for Rate of Change and Concavity
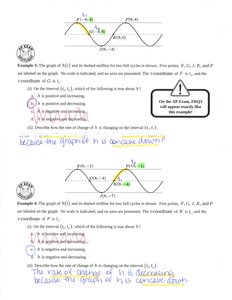
When analyzing graphs, it is important to identify intervals where the function is increasing, decreasing, concave up, or concave down. This analysis helps answer questions about the behavior of the function and its rate of change.
On the AP Exam, questions often ask about the rate of change and concavity of functions.
Use the graph to determine where the function is increasing or decreasing, and whether it is concave up or down.
For example, if the graph is concave down, the rate of change is decreasing. If the graph is concave up, the rate of change is increasing.
Summary Table: Graphical Behavior of Functions
The following table summarizes the graphical behavior of functions:
Behavior | Graph Appearance | Rate of Change |
|---|---|---|
Increasing | Upward slope | Positive |
Decreasing | Downward slope | Negative |
Constant | Flat | Zero |
Concave Up | Bends upward | Increasing |
Concave Down | Bends downward | Decreasing |
Key Formulas and Notation
Rate of Change Formula
The average rate of change of a function f over the interval [a, b] is given by:
This formula calculates the slope of the secant line between two points on the graph.
Interval Notation
Intervals are written using brackets and parentheses:
[a, b]: Includes both endpoints a and b.
(a, b): Excludes both endpoints.
Additional info: These notes provide foundational concepts for analyzing functions graphically, which is essential for understanding more advanced topics in precalculus and calculus.
