 Back
BackFunctions and Their Graphs: Core Concepts and Transformations in Precalculus
Study Guide - Smart Notes
 Tailored notes based on your materials, expanded with key definitions, examples, and context.
Functions and Graphs
Relations and Functions
A relation is any set of ordered pairs. A function is a special type of relation in which each input (x-value) is paired with exactly one output (y-value). The domain of a function is the set of all possible input values, and the range is the set of all possible output values.
Set Notation: Domains and ranges are often written in set notation, e.g., {x | x ≥ 0}.
Example: The relation {(−2, 0), (1, 1), (2, −1), (1, 3)} is not a function because the input 1 is paired with two different outputs (1 and 3).
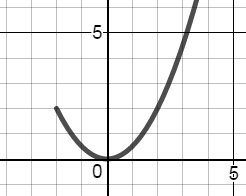
Increasing, Decreasing, and Constant Intervals
The behavior of a function can be described by intervals where it is increasing, decreasing, or constant:
Increasing: A function is increasing on an interval if, as x increases, f(x) also increases.
Decreasing: A function is decreasing on an interval if, as x increases, f(x) decreases.
Constant: A function is constant on an interval if f(x) remains the same as x increases.
Even and Odd Functions
Functions can be classified based on their symmetry:
Even Function: for all x in the domain. Even functions are symmetric about the y-axis.
Odd Function: for all x in the domain. Odd functions have 180° rotational symmetry about the origin.
Neither: If a function does not satisfy either property, it is neither even nor odd.
Example: is an odd function because .
Piecewise Functions
A piecewise function is defined by different expressions over different intervals of the domain. To evaluate a piecewise function, determine which interval the input belongs to and use the corresponding formula.
Example:
To find , use the first piece: .
Analyzing Graphs of Functions
Key Features of Graphs
When analyzing the graph of a function, identify the following:
Domain: All x-values for which the function is defined.
Range: All y-values the function attains.
x-intercepts: Points where the graph crosses the x-axis (set y = 0).
y-intercepts: Points where the graph crosses the y-axis (set x = 0).
Intervals of Increase/Decrease: Where the function rises or falls as x increases.
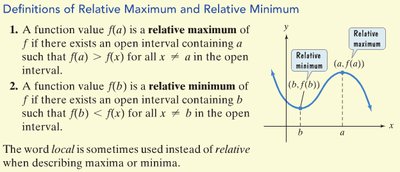
Relative Maxima/Minima: Local highest or lowest points on the graph.
Even/Odd/Neither: Symmetry properties as described above.
Graphing Piecewise Functions
To graph a piecewise function, plot each piece on its specified interval, paying attention to open or closed endpoints.
Example:
Linear Functions and Slope
Slope and Rate of Change
The slope of a line measures its steepness and is calculated as:
Parallel lines have the same slope.
Perpendicular lines have slopes that are negative reciprocals: .
Forms of Linear Equations
Standard Form:
Slope-Intercept Form:
Point-Slope Form:
Horizontal Line: (slope = 0)
Vertical Line: (slope undefined)
Finding Intercepts
x-intercept: Set and solve for .
y-intercept: Set and solve for .
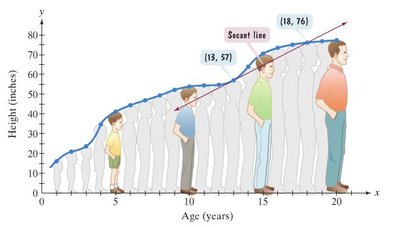
Average Rate of Change
Definition and Application
The average rate of change of a function between and is the slope of the secant line connecting the points and :
Secant Line: The line passing through these two points.
Example: If a man's height is 57 inches at age 13 and 76 inches at age 18, the average rate of change is inches per year.
Difference Quotient
Definition
The difference quotient is a formula that gives the average rate of change of a function over an EP interval of length :
, for
This is foundational for calculus, as it leads to the concept of the derivative.
Transformations of Functions
Reflections
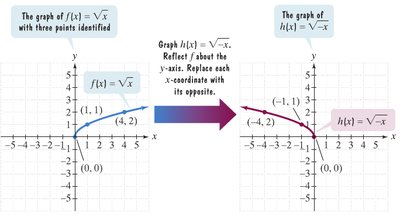
Reflection about the x-axis: reflects the graph over the x-axis (all y-values become their opposites).
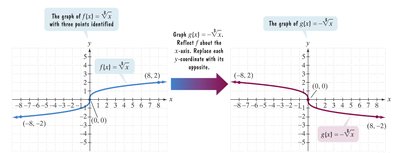
Reflection about the y-axis: reflects the graph over the y-axis (all x-values become their opposites).
Vertical and Horizontal Shifts
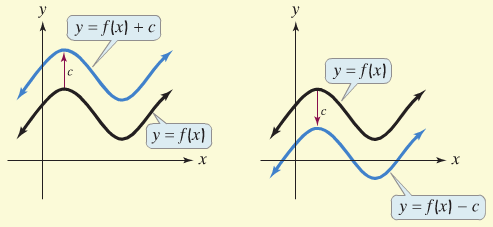
Vertical Shift Up: shifts the graph up by units.
Vertical Shift Down: shifts the graph down by units.
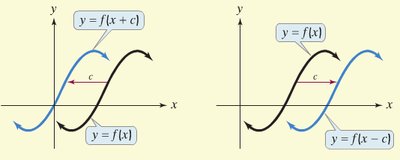
Horizontal Shift Left: shifts the graph left by units.
Horizontal Shift Right: shifts the graph right by units.
Vertical Stretching and Shrinking
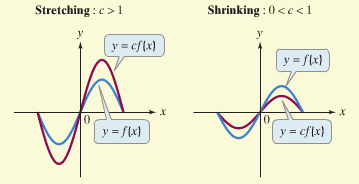
Vertical Stretch: , stretches the graph vertically (y-values are multiplied by ).
Vertical Shrink: , shrinks the graph vertically (y-values are multiplied by ).
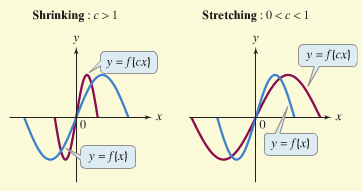
Horizontal Stretching and Shrinking
Horizontal Shrink: , shrinks the graph horizontally (x-values are divided by ).
Horizontal Stretch: , stretches the graph horizontally (x-values are divided by ).
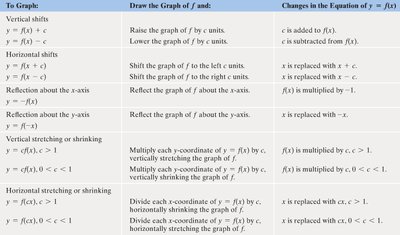
Summary Table of Transformations
The following table summarizes the main types of function transformations:
To Graph: | Draw the Graph of f and: | Changes in the Equation of y = f(x) |
|---|---|---|
Vertical shifts | Raise/lower the graph by c units | c is added/subtracted to f(x) |
Horizontal shifts | Shift left/right by c units | x is replaced with x + c or x - c |
Reflection about x-axis | Reflect about x-axis | f(x) is multiplied by -1 |
Reflection about y-axis | Reflect about y-axis | x is replaced with -x |
Vertical stretching/shrinking | Multiply y-coordinates by c | f(x) is multiplied by c |
Horizontal stretching/shrinking | Divide x-coordinates by c | x is replaced with c x |
Examples of Transformations
Given:
Transformed: (reflect over x-axis, shift left 2, down 8)
Given:
Transformed: (shift right 1, stretch vertically by 2, up 3)
Given:
Transformed: (reflect over y = 1.5, shift down 1)
