 Back
BackFunctions and Their Graphs: Fundamental Concepts and Representations
Study Guide - Smart Notes
 Tailored notes based on your materials, expanded with key definitions, examples, and context.
Chapter 2: Functions and Their Graphs
Section 2.1: Functions
Objective 1: Describe a Relation
A relation is a correspondence between two sets: a set X, called the domain, and a set Y, called the range. In a relation, each element from the domain corresponds to at least one element from the range. If x is an element of the domain and y is an element of the range, and if a relation exists from x to y, then we say that y is related to x, and we write x → y. It is helpful to think of x as the input and y as the output of the relation.
Five ways to express a relation:
Verbally (using words)
Numerically (using a table of numbers or a set of ordered pairs)
Graphically (plotting points or mapping)
Algebraically (using an equation)
Mapping diagrams (showing connections between domain and range)
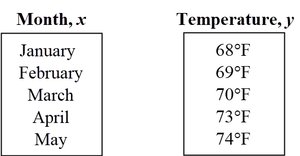
Example: A scientist measures the average high temperature in Los Angeles for the first five months of the year. The domain is the months (January to May), and the range is the corresponding temperatures (68℉, 69℉, 70℉, 73℉, 74℉).
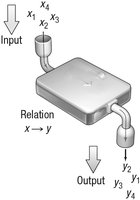
Table Representation:
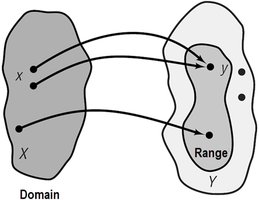
Mapping Representation:
Objective 2: Determine Whether a Relation Represents a Function
A function from set X into set Y is a relation that associates with each element of X exactly one element of Y. The set X is called the domain of the function. For each element x in X, the corresponding element y in Y is called the value of the function at x, or the image of x. The set of all images of the elements in the domain is called the range of the function.
Key property: For a function, each input has exactly one output.
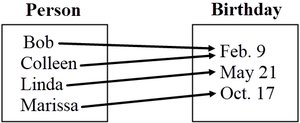
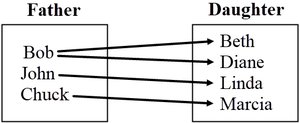
Example: For each relation, state the domain and range. Then determine whether the relation is a function.
Mapping diagrams can help visualize whether each input has only one output.
Is it okay for more than one element in the domain to correspond to the same element in the range? Yes, as long as each input has only one output. Multiple inputs can share the same output.
Objective 3: Use Function Notation; Find the Value of a Function
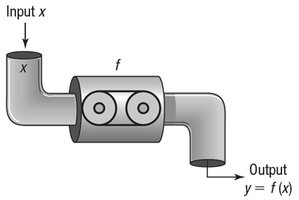
If f is a function, then for each number x in the domain, the corresponding number y in the range is designated by the symbol f(x), read as “f of x,” and we write y = f(x). This is called function notation.
Function as a machine: Think of a function as a machine that receives an input from the domain, manipulates it, and outputs a value in the range.
Restrictions:
It accepts only numbers from the domain.
For each input, there is exactly one output (which may be repeated for different inputs).
Variables:
x: independent variable (can be assigned any number from the domain)
y: dependent variable (its value depends on x)
Example: For the function f defined by an equation, evaluate f at various values of x.
Objective 4: Find the Difference Quotient of a Function
The difference quotient of a function f at x is given by:
The difference quotient is used in calculus to define the derivative.
Example: Find the difference quotient for various functions.
Objective 5: Find the Domain of a Function Defined by an Equation
Often the domain of a function f is not specified; instead, only the equation defining the function is given. In such cases, the domain of f is the largest set of real numbers for which the value f(x) is a real number.
Steps to find the domain:
Start with the domain as the set of all real numbers.
If the equation has a denominator, exclude any numbers for which the denominator is zero.
If the equation has a radical with an even index, exclude any numbers for which the expression inside the radical (the radicand) is negative.
Express the domain using interval notation, set notation, or a list, whichever is most convenient.
Example: Find the domain of functions defined by equations and in applications (e.g., area of a square or triangle).
Application: In real-world problems, the domain may be restricted by physical or geometric considerations.
Objective 6: Find the Sum, Difference, Product, and Quotient of Two Functions
Given functions f and g, we can define new functions by combining them:
Sum Function:
Difference Function:
Product Function:
Quotient Function: , where
Domain: The domain of each combined function is the intersection of the domains of f and g, with additional restrictions for the quotient function (where g(x) ≠ 0).
Example: Let f and g be two functions defined by equations. Find their sum, difference, product, and quotient, and determine the domain.
Summary Table: Ways to Represent Relations and Functions
Representation | Description | Example |
|---|---|---|
Verbal | Using words to describe the relation | "The temperature in Los Angeles varies by month." |
Numerical | Table of values or ordered pairs | See table of months and temperatures |
Graphical | Plotting points or mapping diagrams | See mapping diagram of domain and range |
Algebraic | Using equations | |
Mapping | Diagram showing connections | See mapping diagrams for birthdays and daughters |
Additional info: The notes above expand on brief points from the original material, providing academic context, definitions, and examples suitable for precalculus students. All included images directly reinforce the explanation of relations, functions, and their representations.
