 Back
Functions and Their Graphs: Identification and Analysis
Study Guide - Smart Notes
 Tailored notes based on your materials, expanded with key definitions, examples, and context.
Functions and Their Graphs
Identifying the Graph of a Function
The graph of a function is a visual representation of the relationship between input values (x) and output values (y). Not every graph in the xy-plane represents a function. The Vertical-Line Test is a fundamental method used to determine whether a graph represents a function.
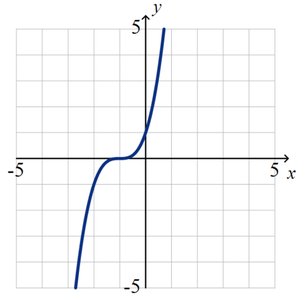
Vertical-Line Test: A set of points in the xy-plane is the graph of a function if and only if every vertical line intersects the graph in at most one point.
Reason: If a vertical line crosses the graph more than once, a single input x corresponds to multiple outputs y, violating the definition of a function.
Example: The graphs of and pass the vertical-line test and are functions.
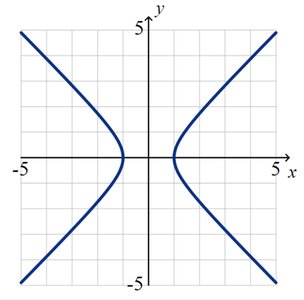
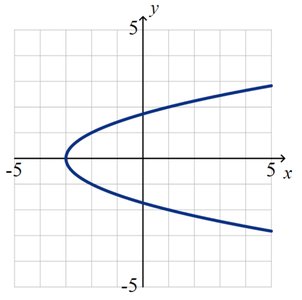
Non-Function Example: The graphs of and fail the vertical-line test, as some vertical lines intersect the graph at more than one point.
Explanation: For , the input corresponds to two outputs ( and ), so it is not a function.
Obtaining Information from the Graph of a Function
Once a graph is confirmed to represent a function, various properties and information can be extracted from it. These include the domain, range, intercepts, and specific values.
Domain: The set of all possible input values (x) for which the function is defined.
Range: The set of all possible output values (y) that the function can produce.
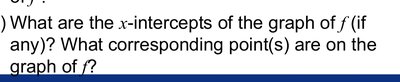
Intercepts: Points where the graph crosses the axes. The x-intercept is where , and the y-intercept is where .
Specific Values: The value of the function at particular inputs, such as , , and .
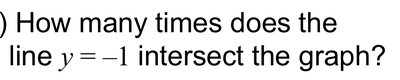
Intersection with Lines: The number of times a horizontal line (e.g., ) intersects the graph indicates how many solutions exist for .
Solving for x: For a given output, such as , determine the corresponding input values.
Positive Values: Identify the intervals where .






Example: Analyzing a Specific Function
Consider the function . The following steps illustrate how to extract information from its graph and formula:
Domain: Find all x-values for which the function is defined. For rational functions, exclude values that make the denominator zero.
Point on the Graph: To check if is on the graph, substitute into and see if the output matches .
Evaluating at a Point: For , calculate and identify the corresponding point .
Solving for x: If , solve for x and find the corresponding point.
x-Intercepts: Set and solve for x to find where the graph crosses the x-axis.




Summary Table: Function Graph Analysis
Property | How to Find | Example |
|---|---|---|
Domain | Identify all x-values for which the function is defined | Exclude x where denominator is zero |
Range | Identify all y-values the function can take | Analyze graph or solve for y |
x-Intercept | Set y = 0 and solve for x | Find x where |
y-Intercept | Set x = 0 and solve for y | Find |
Specific Value | Substitute x into function | |
Point on Graph | Check if (x, y) satisfies | Is on graph? |
Additional info: The notes cover Section 2.2 "The Graph of a Function" from a Precalculus textbook, focusing on graphical identification and analysis of functions, including the vertical-line test, domain, range, intercepts, and evaluation of function values.
