 Back
Functions and Their Graphs: Intercepts, Symmetry, Domain, Range, and Operations
Study Guide - Smart Notes
 Tailored notes based on your materials, expanded with key definitions, examples, and context.
Graphs, Equations, and Intercepts
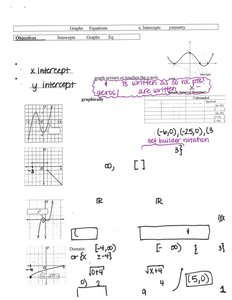
Understanding Intercepts
Intercepts are fundamental points where a graph crosses the axes. These points provide essential information about the behavior of functions and their equations.
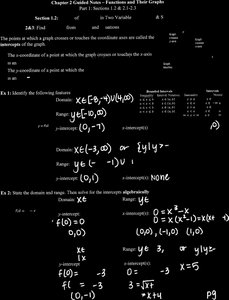
x-intercept: The point(s) where the graph crosses the x-axis. Found by setting y = 0 in the equation and solving for x.
y-intercept: The point where the graph crosses the y-axis. Found by setting x = 0 in the equation and solving for y.
Example: For the function f(x) = 2x^2 + 4x - 15:
To find x-intercepts: Set f(x) = 0 and solve for x.
To find y-intercept: Evaluate f(0).
Domain and Range of Functions
Definitions and Notation
The domain of a function is the set of all possible input values (x-values) for which the function is defined. The range is the set of all possible output values (y-values) the function can produce.
Interval notation: Used to describe domains and ranges, e.g., (-∞, 3) or [0, ∞).
Set-builder notation: Describes the set using properties, e.g., {x | x > 0}.
Example: For f(x) = \sqrt{x-4}, the domain is x \geq 4 because the expression under the square root must be non-negative.
Symmetry in Graphs
Types of Symmetry
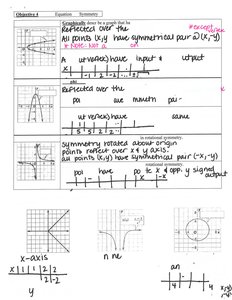
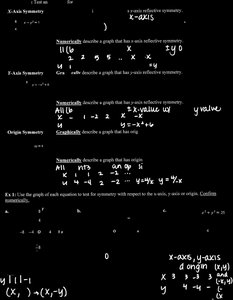
Symmetry helps classify functions and predict their behavior. There are three main types:
y-axis symmetry (Even functions): The graph is unchanged when reflected over the y-axis. Algebraically, f(-x) = f(x) for all x in the domain.
x-axis symmetry: The graph is unchanged when reflected over the x-axis. Not a function if it passes the vertical line test.
Origin symmetry (Odd functions): The graph is unchanged when rotated 180° about the origin. Algebraically, f(-x) = -f(x) for all x in the domain.
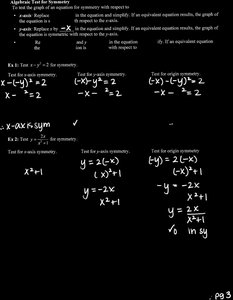
Testing for Symmetry Algebraically
Replace x with -x in the equation and simplify.
If the result is the same as the original, the function is even (y-axis symmetry).
If the result is the negative of the original, the function is odd (origin symmetry).
Even and Odd Functions
Definitions and Properties
Functions can be classified as even, odd, or neither based on their symmetry properties.
Even function: f(-x) = f(x) for all x in the domain. Graph is symmetric about the y-axis.
Odd function: f(-x) = -f(x) for all x in the domain. Graph is symmetric about the origin.
Neither: If neither condition holds, the function is neither even nor odd.
Operations with Functions
Sum, Difference, Product, and Quotient
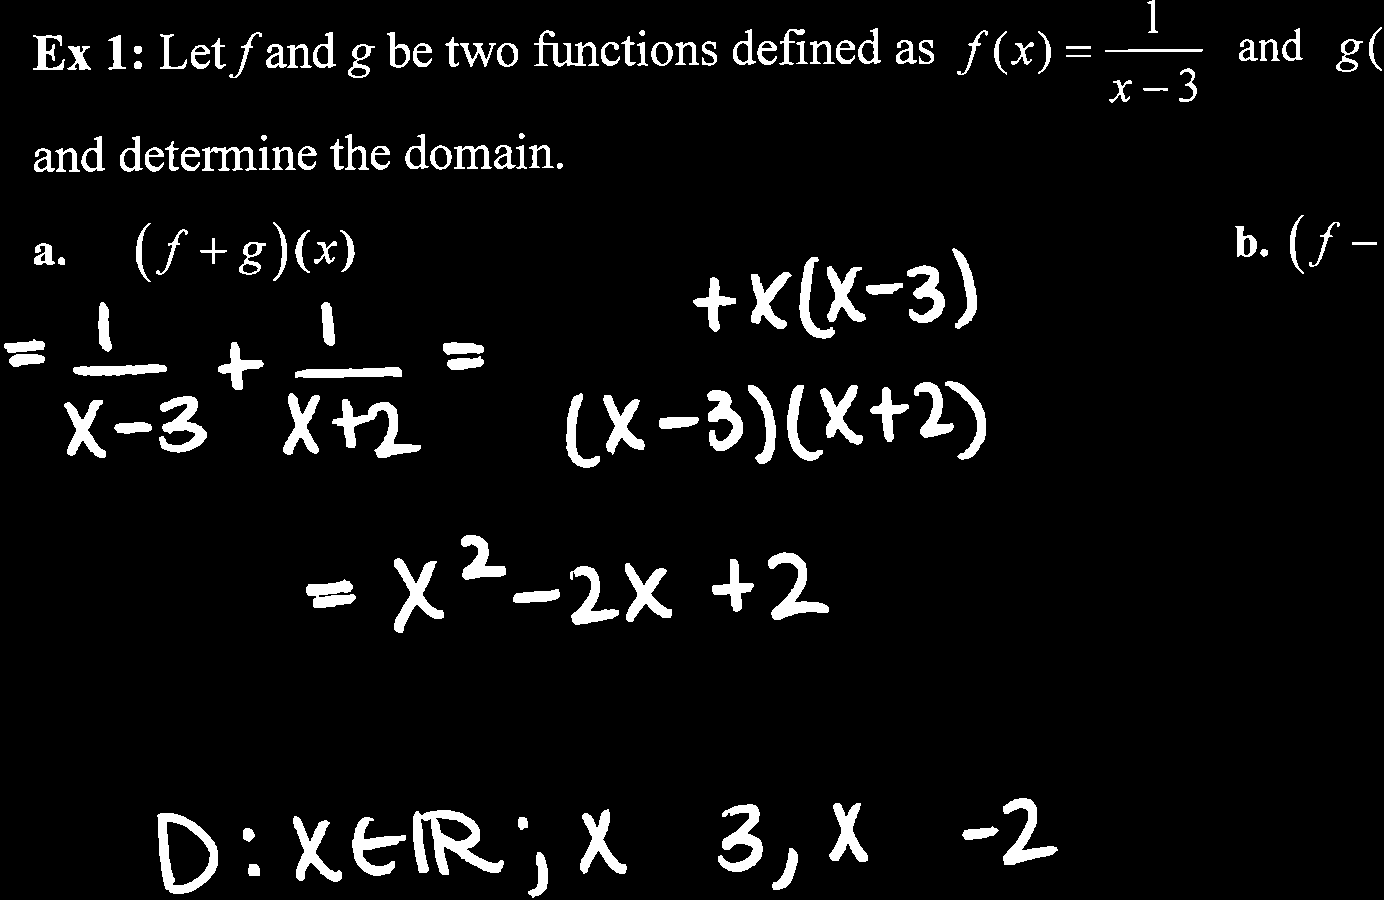
Functions can be combined using arithmetic operations. The domain of the resulting function is the intersection of the domains of the original functions (except for division, where the denominator cannot be zero).
Sum: (f+g)(x) = f(x) + g(x)
Difference: (f-g)(x) = f(x) - g(x)
Product: (fg)(x) = f(x)g(x)
Quotient: (f/g)(x) = \frac{f(x)}{g(x)}, g(x) \neq 0
Intervals of Increase, Decrease, and Constancy
Definitions
A function is:
Increasing on an interval if its output values rise as x increases.
Decreasing on an interval if its output values fall as x increases.
Constant on an interval if its output values remain unchanged as x increases.
Local and Absolute Extrema
Definitions
Local maximum/minimum: The highest/lowest point in a small neighborhood of the graph. Absolute maximum/minimum: The highest/lowest point over the entire domain of the function.
To find extrema, look for points where the function changes from increasing to decreasing (maximum) or decreasing to increasing (minimum).
Average Rate of Change
Definition and Formula
The average rate of change of a function between two points x_1 and x_2 is given by:
This measures how much the function's output changes per unit change in input over the interval.
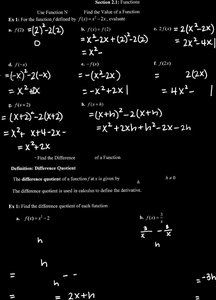
Difference Quotient
Definition
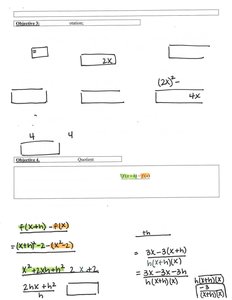
The difference quotient is a formula used to compute the average rate of change of a function over an interval of length h:
This concept is foundational for calculus and helps in understanding derivatives.
Summary Table: Symmetry Types
Symmetry Type | Test | Graphical Meaning |
|---|---|---|
y-axis (Even) | f(-x) = f(x) | Symmetric about y-axis |
Origin (Odd) | f(-x) = -f(x) | Symmetric about origin |
x-axis | Replace y with -y | Symmetric about x-axis (not a function) |
Practice and Application
Identify intercepts, domain, and range from equations and graphs.
Test for symmetry both graphically and algebraically.
Combine functions and determine the domain of the result.
Use the difference quotient to find average rates of change.
