 Back
Functions and Their Graphs: Precalculus Study Notes
Study Guide - Smart Notes
 Tailored notes based on your materials, expanded with key definitions, examples, and context.
Chapter 2: Functions and Their Graphs
Section 2.1: Functions
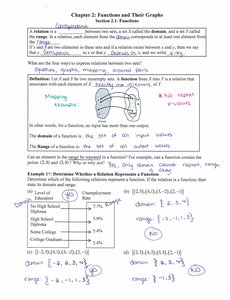
A function is a relation between two sets, X and Y, where each element of X is paired with exactly one element of Y. The set X is called the domain, and the set Y is called the range. Functions are fundamental objects in mathematics, used to describe relationships between quantities.
Domain: The set of all possible input values (x-values).
Range: The set of all possible output values (y-values).
Function notation: denotes the output of function f for input x.
Example: If , then .
Section 2.1: Domain of a Function
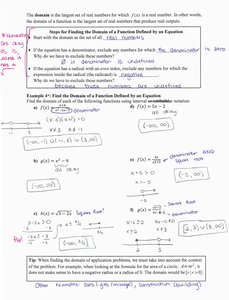
The domain of a function is the largest set of real numbers for which the function is defined. When finding the domain of a function defined by an equation, exclude any values that make the denominator zero or result in an even root of a negative number.
For rational functions, exclude values that make the denominator zero.
For even roots (e.g., square roots), exclude values that make the radicand negative.
Example: For , the domain is all real numbers except .
Section 2.2: The Graph of a Function
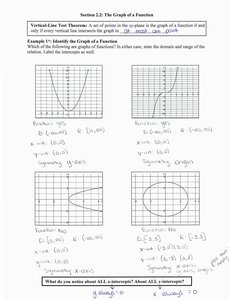
The graph of a function is the set of all points in the coordinate plane. The Vertical Line Test is used to determine if a graph represents a function: if any vertical line intersects the graph at more than one point, the graph does not represent a function.
x-intercept: The point(s) where the graph crosses the x-axis ().
y-intercept: The point where the graph crosses the y-axis ().
Example: The graph of passes the vertical line test and is a function.
Section 2.2: Obtaining Information from Graphs
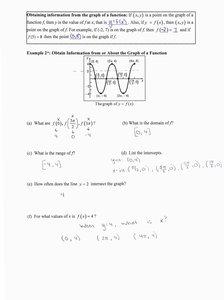
Information such as domain, range, intercepts, and intervals where the function is positive or negative can be obtained from the graph of a function. For example, the domain is the set of all x-values for which the graph exists, and the range is the set of all y-values the graph attains.
To find intercepts, set (for y-intercept) or (for x-intercepts).
To find where , look for intervals where the graph is above the x-axis.
Section 2.3: Properties of Functions
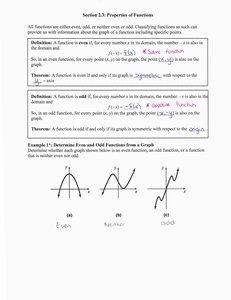
Functions can be classified as even, odd, or neither. These properties are useful for analyzing symmetry in graphs.
Even function: for all in the domain. The graph is symmetric with respect to the y-axis.
Odd function: for all in the domain. The graph is symmetric with respect to the origin.
Example: is even; is odd.
Section 2.3: Increasing, Decreasing, and Constant Functions
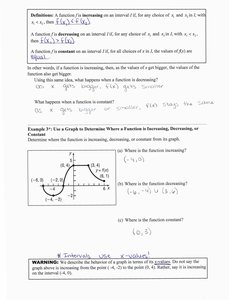
A function is increasing on an interval if, as increases, increases. It is decreasing if decreases as increases. If $f(x)$ remains the same, the function is constant on that interval.
Increasing: For , .
Decreasing: For , .
Constant: For , .
Section 2.3: Local Maxima and Minima
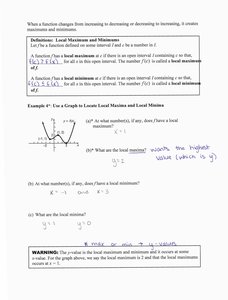
A function has a local maximum at if is greater than all nearby values of . It has a local minimum at if is less than all nearby values of . These points are important for analyzing the behavior of functions.
Local maximum: Highest point in a small interval.
Local minimum: Lowest point in a small interval.
Section 2.4: Library of Functions and Piecewise-defined Functions
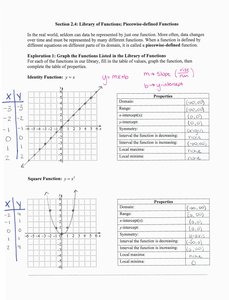
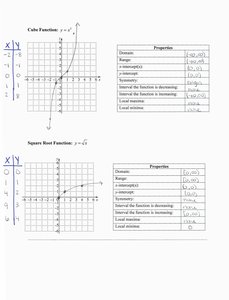
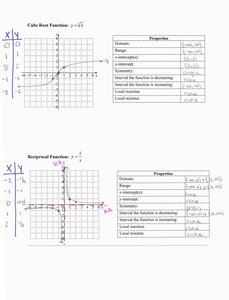
Several basic functions serve as building blocks for more complex functions. These include the identity, square, cube, square root, cube root, and reciprocal functions. Each has characteristic graphs and properties.
Identity function:
Square function:
Cube function:
Square root function:
Cube root function:
Reciprocal function:
Each function has a specific domain, range, symmetry, and intercepts.
Section 2.5: Graphing Techniques—Transformations
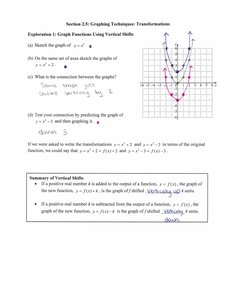
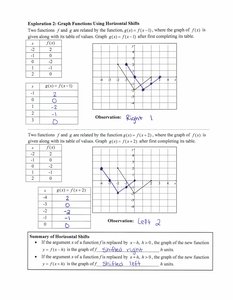
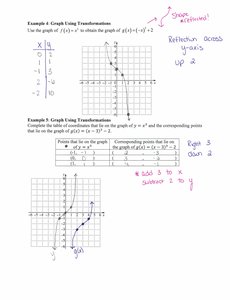
Functions can be transformed by shifting, stretching, compressing, or reflecting their graphs. Understanding these transformations helps in graphing complex functions quickly.
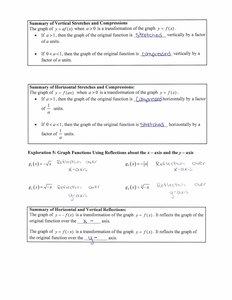
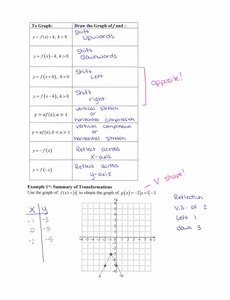
Vertical shift: shifts the graph up if , down if .
Horizontal shift: shifts the graph right if , left if .
Vertical stretch/compression: stretches if , compresses if .
Horizontal stretch/compression: compresses if , stretches if .
Reflection: reflects across the x-axis; reflects across the y-axis.
Summary Table: Common Function Transformations
Transformation | Effect on Graph |
|---|---|
Shift up by units | |
Shift down by units | |
Shift right by units | |
Shift left by units | |
Vertical stretch/compression by | |
Horizontal stretch/compression by | |
Reflect across x-axis | |
Reflect across y-axis |
Additional info: These notes cover the foundational concepts of functions, their properties, and transformations, which are essential for further study in Precalculus and Calculus.
