Back
Functions: Definitions, Properties, and Graphical Analysis
Study Guide - Smart Notes
 Tailored notes based on your materials, expanded with key definitions, examples, and context.
Chapter 2: Functions
A. Functions
Functions are foundational objects in mathematics that describe a relationship between two sets, typically called the domain and the range. Understanding functions is essential for analyzing mathematical models and solving real-world problems.
Definition of Relation
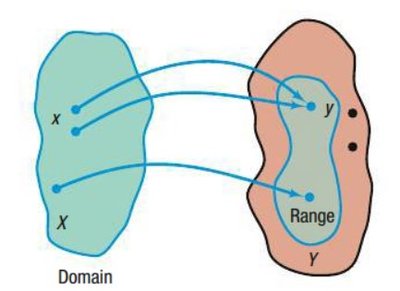
Relation: A relation is a correspondence between two sets: a set X (the domain) and a set Y (the range). Each element from the domain corresponds to at least one element from the range.

Definition of Function
Function: A function from X into Y is a relation that associates each element of X with exactly one element of Y.

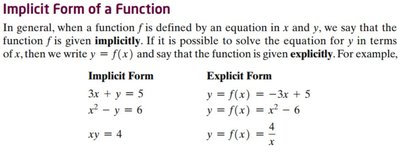
Implicit and Explicit Forms of Functions
Implicit Form: A function is given implicitly if it is defined by an equation in x and y (e.g., 3x + y = 5).
Explicit Form: If it is possible to solve for y in terms of x, the function is given explicitly (e.g., y = f(x) = -3x + 5).
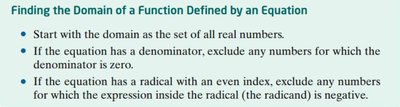
Finding the Domain of a Function Defined by an Equation
Start with the domain as the set of all real numbers.
If the equation has a denominator, exclude any numbers for which the denominator is zero.
If the equation has a radical with an even index, exclude any numbers for which the expression inside the radical is negative.
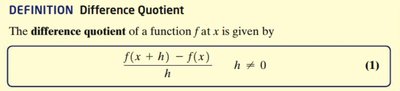
Difference Quotient
Difference Quotient: For a function f at x, the difference quotient is given by:
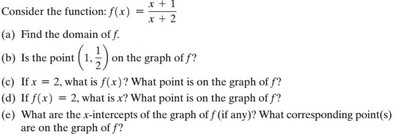
Example: Domain and Graphical Questions
Given f(x) = \frac{x+1}{x+2}:
(a) Find the domain of f.
(b) Is the point (1, \frac{1}{2}) on the graph of f?
(c) If x = 2, what is f(x)? What point is on the graph of f?
(d) If f(x) = 2, what is x? What point is on the graph of f?
(e) What are the x-intercepts of the graph of f (if any)? What corresponding point(s) are on the graph of f?
Obtaining Information from or about the Graph of a Function
If (x, y) is a point on the graph of a function f, then y is the value of f at x: y = f(x).
If y = f(x), then (x, y) is a point on the graph of f.

Example: Graphical Analysis
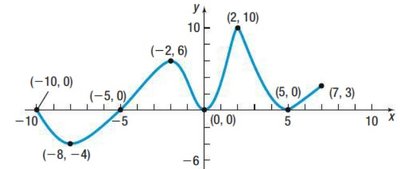
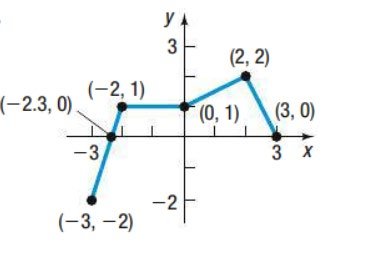
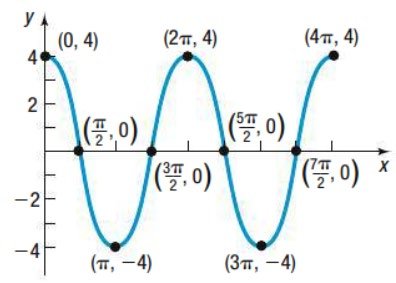
Given a graph, answer questions such as:
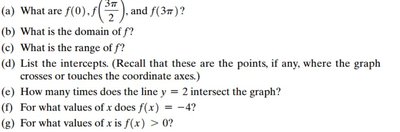
What are f(0), f(\frac{3\pi}{2}), and f(3\pi)?
What is the domain and range of f?
List the intercepts, intervals of increase/decrease, and values where f(x) is positive or negative.
B. Graph of a Function
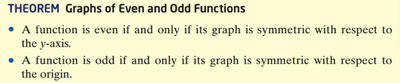
Graphs visually represent the relationship between the domain and range of a function. Key features include intercepts, intervals of increase/decrease, and symmetry.
C. Properties of Functions
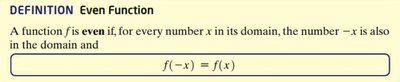
Even Function: for all in the domain.
Odd Function: for all in the domain.
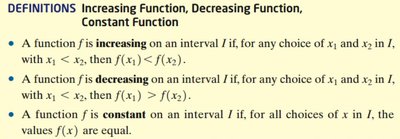
Increasing/Decreasing/Constant: Definitions as given above.
D. Local Maximum/Minimum
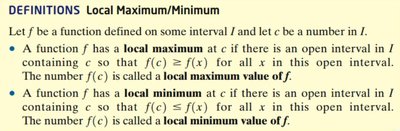
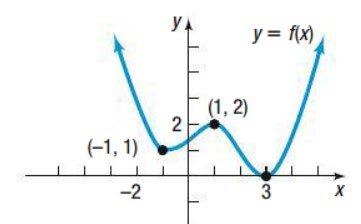
A function f has a local maximum at c if for all near .
A function f has a local minimum at c if for all near .
E. Extreme Value Theorem
If a function f is continuous on a closed interval , then f has an absolute maximum and minimum on .
F. Example Graphs