 Back
Functions, Graphs, and Their Properties: Precalculus Study Guide
Study Guide - Smart Notes
 Tailored notes based on your materials, expanded with key definitions, examples, and context.
Functions and Their Graphs
Intercepts and Graphical Representation
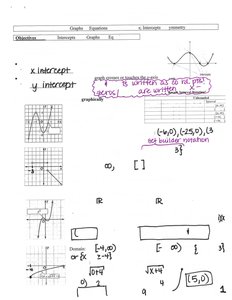
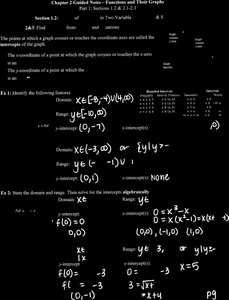
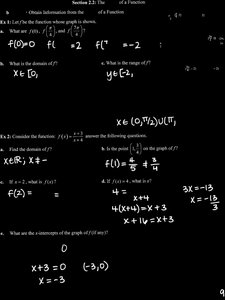
Understanding the intercepts of a function is fundamental in graph analysis. The x-intercept is where the graph crosses the x-axis, and the y-intercept is where it crosses the y-axis. These points are often written as ordered pairs and are crucial for sketching and interpreting graphs.
x-intercept: The value of x when y = 0.
y-intercept: The value of y when x = 0.
Graphical notation: Intercepts are written as (x, 0) or (0, y).
Set builder notation: Used to describe the domain and range of functions.
Domain and Range
The domain of a function is the set of all possible input values (x-values), while the range is the set of all possible output values (y-values). These are often described using interval notation or set builder notation.
Domain: or (all real numbers).
Range: or .
Interval notation: Used to specify continuous ranges, e.g., .
Symmetry in Graphs
Types of Symmetry
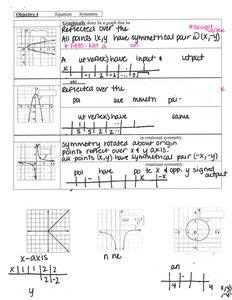
Graphs can exhibit different types of symmetry, which help in understanding their properties and behavior.
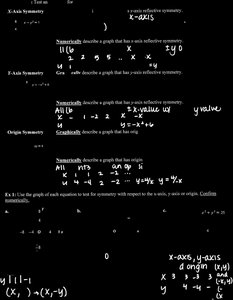
x-axis symmetry: If replacing y with -y yields the same equation, the graph is symmetric about the x-axis.
y-axis symmetry: If replacing x with -x yields the same equation, the graph is symmetric about the y-axis.
Origin symmetry: If replacing (x, y) with (-x, -y) yields the same equation, the graph is symmetric about the origin.
Algebraic Tests for Symmetry
To test for symmetry algebraically, substitute variables as follows:
x-axis: Replace y with -y.
y-axis: Replace x with -x.
Origin: Replace x with -x and y with -y.

Even and Odd Functions
Definitions and Properties
Functions can be classified as even, odd, or neither based on their symmetry.
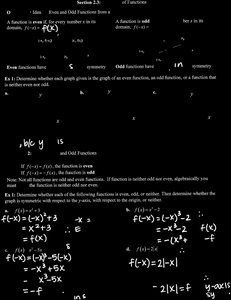
Even function: for all x in the domain. Graph is symmetric about the y-axis.
Odd function: for all x in the domain. Graph is symmetric about the origin.
Neither: If neither condition is satisfied.
Testing Functions for Evenness or Oddness
To determine if a function is even, odd, or neither, substitute -x for x and compare the result to the original function.
Example: is even because .
Example: is odd because .
Increasing, Decreasing, and Constant Intervals
Definitions
A function can be described as increasing, decreasing, or constant over specific intervals.
Increasing: The function's output increases as the input increases.
Decreasing: The function's output decreases as the input increases.
Constant: The function's output remains unchanged as the input increases.
Local and Absolute Extrema
Extrema refer to the maximum and minimum values of a function. Local extrema are the highest or lowest points within a specific interval, while absolute extrema are the highest or lowest points over the entire domain.
Local maximum: Highest value in a neighborhood.
Local minimum: Lowest value in a neighborhood.
Absolute maximum: Highest value over the domain.
Absolute minimum: Lowest value over the domain.
Operations on Functions
Sum, Difference, Product, and Quotient
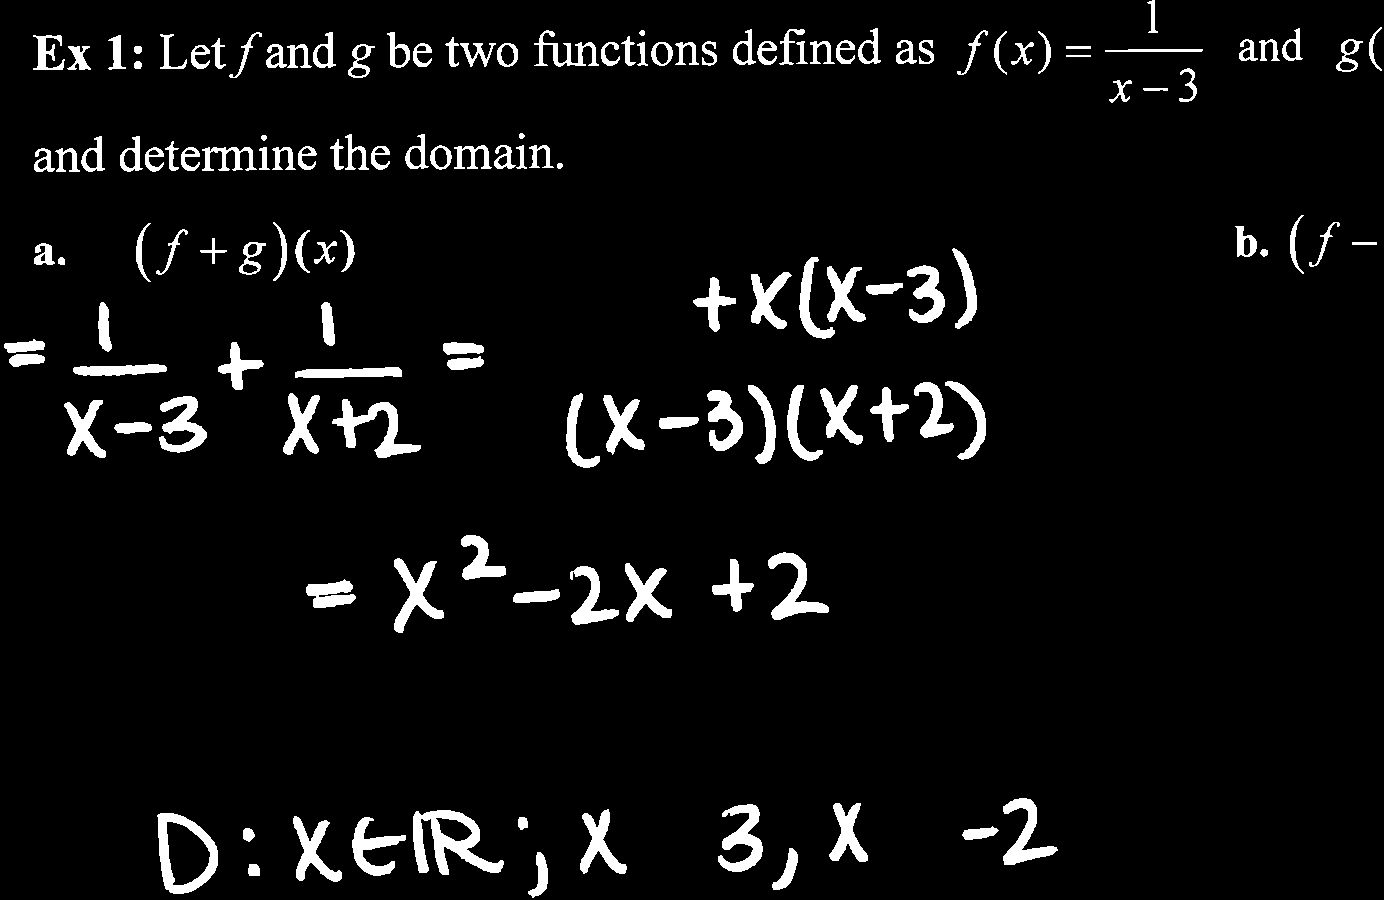
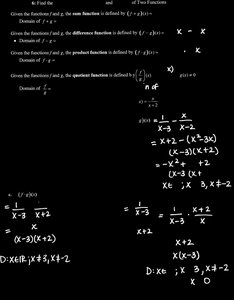
Functions can be combined using addition, subtraction, multiplication, and division. The domain of the resulting function is the intersection of the domains of the original functions, except for division, where the denominator cannot be zero.
Sum:
Difference:
Product:
Quotient: ,
Difference Quotient
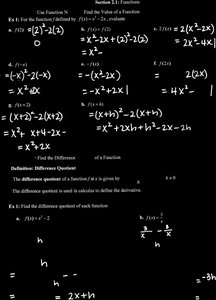
The difference quotient is a fundamental concept for understanding rates of change and is used in calculus to define derivatives.
Formula:
Application: Used to calculate the average rate of change over an interval.
Practice and Applications
Finding Domain and Range Algebraically
To find the domain and range of a function algebraically, identify values that make the function undefined (such as division by zero or taking the square root of a negative number).
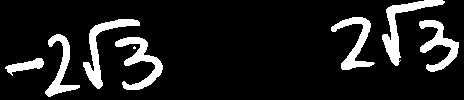
Example: For , the domain is .
Example: For , the domain is .
Graphical Interpretation
Graphs are used to visually estimate domain, range, intercepts, and symmetry. Practice problems often involve interpreting graphs to answer questions about function properties.
Summary Table: Symmetry Types
Type of Symmetry | Algebraic Test | Graphical Feature |
|---|---|---|
x-axis | Replace y with -y | Symmetric about x-axis |
y-axis | Replace x with -x | Symmetric about y-axis |
Origin | Replace (x, y) with (-x, -y) | Symmetric about origin |
Summary Table: Function Operations
Operation | Formula | Domain |
|---|---|---|
Sum | Intersection of domains | |
Difference | Intersection of domains | |
Product | Intersection of domains | |
Quotient | Intersection, |
Additional info:
Some context and examples were inferred from standard Precalculus curriculum to ensure completeness.
Images included are only those directly relevant to the explanation of the adjacent paragraph.
