 Back
BackGraphing and Analyzing Rational Functions
Study Guide - Smart Notes
 Tailored notes based on your materials, expanded with key definitions, examples, and context.
Polynomial and Rational Functions
The Graph of a Rational Function
Rational functions are quotients of two polynomials. Their graphs can display a variety of features, including intercepts, asymptotes, and holes. Understanding these features is essential for accurate graphing and analysis.
Definition of a Rational Function
Rational Function: A function of the form , where and are polynomials and .
Steps for Analyzing the Graph of a Rational Function
Step 1: Factor and Find the Domain Factor both the numerator and denominator. The domain consists of all real numbers except those that make the denominator zero.
Step 2: Lowest Terms Simplify the function by canceling common factors. This helps identify holes in the graph.
Step 3: Intercepts
y-intercept: Set and solve for , if defined.
x-intercepts: Set the numerator equal to zero and solve for (with the function in lowest terms).
Multiplicity: If a zero has odd multiplicity, the graph crosses the axis; if even, it touches and turns around.
Step 4: Vertical Asymptotes Set the denominator equal to zero (after simplification). Each real zero gives a vertical asymptote. The behavior near the asymptote depends on the multiplicity of the zero.
Step 5: Horizontal or Oblique Asymptotes
Horizontal Asymptote: If the degree of the numerator is less than or equal to the degree of the denominator, compare leading coefficients.
Oblique (Slant) Asymptote: If the degree of the numerator is exactly one more than the denominator, use polynomial long division.
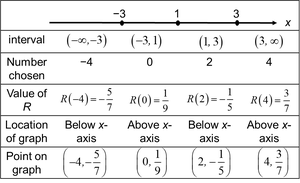
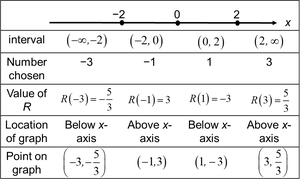
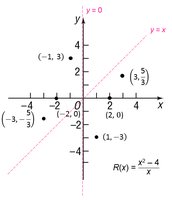
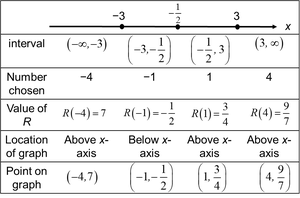
Step 6: Intervals and Test Points Use the zeros of the numerator and denominator to divide the x-axis into intervals. Test a value in each interval to determine if the graph is above or below the x-axis.
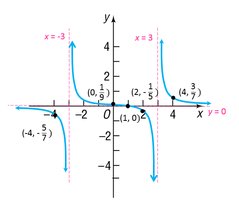
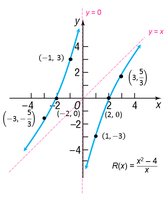
Step 7: Sketch the Graph Combine all information to sketch the graph, including intercepts, asymptotes, and behavior in each interval.
Summary Table: Steps for Analyzing Rational Functions
Step | Description |
|---|---|
1 | Factor numerator and denominator; find domain |
2 | Simplify to lowest terms |
3 | Find and plot intercepts; use multiplicity |
4 | Find and graph vertical asymptotes; analyze behavior near them |
5 | Find horizontal/oblique asymptotes; check for intersections |
6 | Divide x-axis into intervals; test points for sign |
7 | Sketch the graph using all information |
Example 1: Analyzing a Rational Function
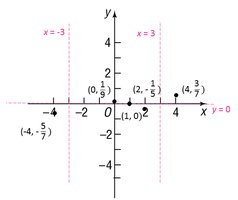
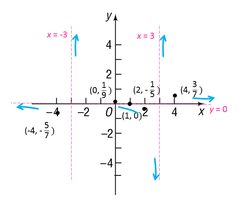
This example demonstrates the step-by-step process for analyzing and graphing a rational function, including finding intercepts, asymptotes, and the behavior in each interval.
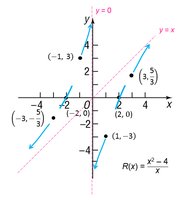
Example 2: Rational Function with an Oblique Asymptote
When the degree of the numerator is one more than the denominator, the graph has an oblique (slant) asymptote. Use long division to find the equation of the asymptote.
Example 3: Rational Function with No Real Zeros
Some rational functions may have no real x-intercepts if the numerator has no real zeros. The behavior near vertical asymptotes depends on the multiplicity of the zero in the denominator.
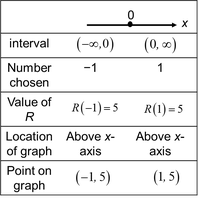
Example 4: Rational Function with Horizontal Asymptote
If the degrees of the numerator and denominator are equal, the horizontal asymptote is determined by the ratio of the leading coefficients.
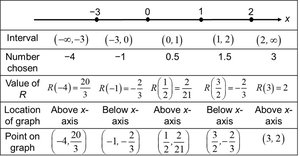
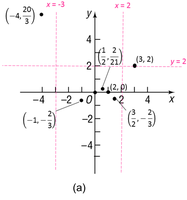
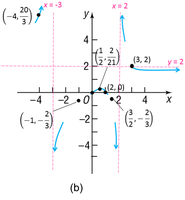
Example 5: Rational Function with a Hole
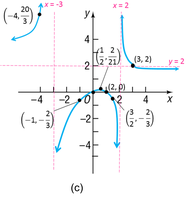
If a factor cancels from both the numerator and denominator, the graph has a hole at the corresponding x-value. The y-value of the hole is found by substituting into the simplified function.
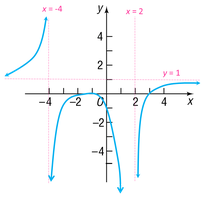
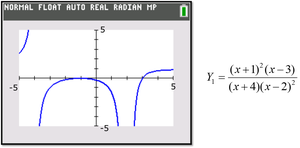
Example 6: Constructing a Rational Function from Its Graph
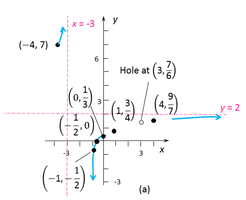
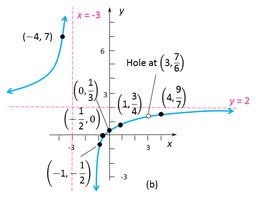
Given a graph, you can construct a rational function by identifying x-intercepts (numerator), vertical asymptotes (denominator), and horizontal asymptotes (degree and leading coefficient ratio).
Applications of Rational Functions
Example 7: Finding the Least Cost of a Can
Rational functions are used in optimization problems, such as minimizing the cost of materials for a cylindrical can with a fixed volume. The cost function is expressed in terms of the radius, and calculus or graphing utilities are used to find the minimum.
Surface Area of a Cylinder: The total surface area is the sum of the lateral area and the areas of the top and bottom.
Cost Function: Expressed as , where is the radius and is the height, subject to the constraint .
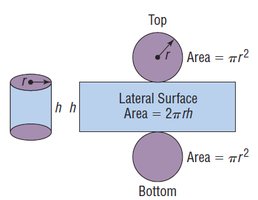
By substituting for in terms of , the cost function becomes a rational function of $r$.
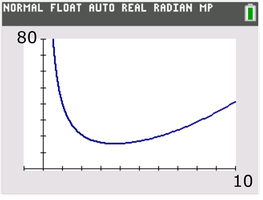
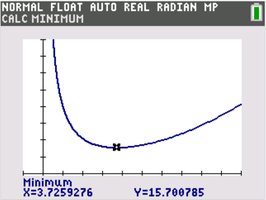
Minimum Cost: The minimum value of the cost function occurs at a specific radius, which can be found using graphing technology or calculus.
Additional info: Rational functions are widely used in modeling real-world phenomena, including rates, optimization, and economics. Mastery of their graphical features is essential for further study in calculus and applied mathematics.
