 Back
BackGraphing Exponential Functions and Identifying Their Properties
Study Guide - Smart Notes
 Tailored notes based on your materials, expanded with key definitions, examples, and context.
Q1. Draw the graph of the following function.
Background
Topic: Graphing Exponential Functions
This question tests your understanding of how to graph exponential functions and recognize their key features, such as intercepts, growth/decay behavior, and specific points on the graph.
Key Terms and Formulas
Exponential Function: A function of the form , where and .
Growth vs. Decay: If , the function shows exponential growth; if , it shows exponential decay.
Key Points: The y-intercept is always at for . Other points can be found by substituting values for .
Step-by-Step Guidance
Identify the base of the exponential function you are graphing. For example, if the function is , then .
Calculate and plot several key points, such as , , , and . For :
Draw the curve through these points, noting that the graph increases rapidly for positive (exponential growth) and approaches the x-axis (but never touches it) for negative $x$.
Label the y-intercept and other calculated points on your graph for clarity.
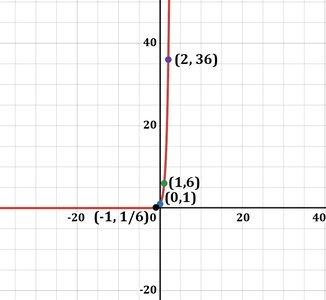
Try solving on your own before revealing the answer!
Final Answer:
The graph shown matches , with points , , , and labeled. The curve demonstrates exponential growth as increases.
