 Back
Graphs and Transformations of Sine and Cosine Functions
Study Guide - Smart Notes
 Tailored notes based on your materials, expanded with key definitions, examples, and context.
Graphs of the Sine and Cosine Functions
Objectives
This section covers the fundamental properties and transformations of the sine and cosine functions. Students will learn to:
Recall the basic shapes and key features of y = sin x and y = cos x.
Graph transformations of sinusoids: y = A \sin(Bx - C) + D and y = A \cos(Bx - C) + D.
Read amplitude, period, phase shift, and midline from an equation (and vice versa).
Period and Zeros/Extrema
Both sin x and cos x are periodic functions with period (or 360°). Their zeros and extrema are as follows:
sin x: Zeros at ; maximum $1x = \frac{\pi}{2} + 2n\pi-1$ at $x = \frac{3\pi}{2} + 2n\pi$.
cos x: Zeros at ; maximum $1x = 2n\pi-1$ at $x = \pi + 2n\pi$.
Key Values of Sine and Cosine on [0, 2π]
The following tables summarize the values of sin x and cos x at key points in one period:
cos x on [0, 2\pi] | 0 | \frac{\pi}{2} | \pi | \frac{3\pi}{2} | 2\pi |
|---|---|---|---|---|---|
y | 1 | 0 | -1 | 0 | 1 |
sin x on [0, 2\pi] | 0 | \frac{\pi}{2} | \pi | \frac{3\pi}{2} | 2\pi |
|---|---|---|---|---|---|
y | 0 | 1 | 0 | -1 | 0 |
General Sinusoid and Transformations
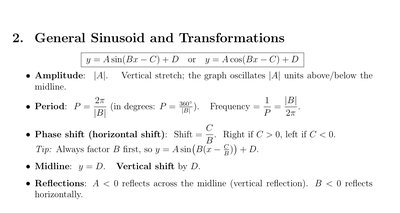
The general form for a sinusoidal function is y = A \sin(Bx - C) + D or y = A \cos(Bx - C) + D. Each parameter affects the graph in a specific way:
Amplitude: . This is the vertical stretch; the graph oscillates $|A|$ units above and below the midline.
Period: (in degrees: ). Frequency: .
Phase shift (horizontal shift): Shift . Right if , left if . Tip: Always factor first, so .
Midline: . This is a vertical shift by .
Reflections: reflects across the midline (vertical reflection). reflects horizontally.
Example: Constructing a Cosine Function from Parameters
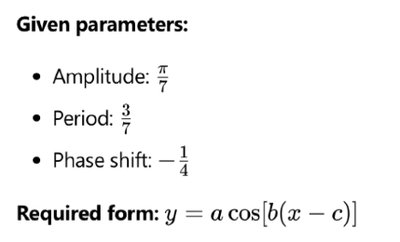
Given the following parameters:
Amplitude:
Period:
Phase shift:
The required form is:
Graphing Sinusoidal Functions
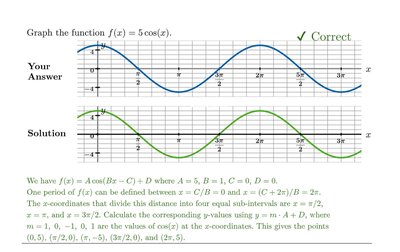
To graph a function such as f(x) = 5 \cos(x):
Identify , , , .
One period of can be defined between and .
The -coordinates that divide this distance into four equal sub-intervals are , , and .
Calculate the corresponding -values using , where (the values of at the -coordinates).
Example: Graph of a Sinusoidal Function
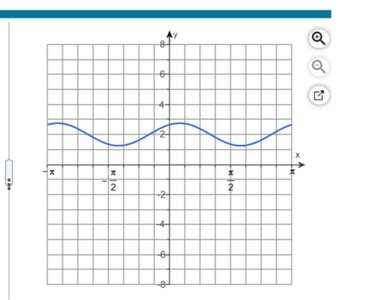
The graph below shows a sinusoidal function with amplitude, period, and midline clearly visible. The function oscillates between its maximum and minimum values, demonstrating the effect of amplitude and period.
Summary Table: Sinusoidal Function Parameters
Parameter | Effect on Graph |
|---|---|
Amplitude () | Vertical stretch; distance from midline to peak |
Period () | Length of one cycle; |
Phase Shift () | Horizontal shift; right if , left if |
Midline () | Vertical shift; midline at |
Reflection | reflects vertically; reflects horizontally |
Practice and Applications
Given a sinusoidal equation, identify amplitude, period, phase shift, and midline.
Graph sinusoidal functions using these parameters.
Apply transformations to model real-world periodic phenomena, such as sound waves or seasonal temperature changes.
