 Back
Graphs, Functions, and Coordinate Systems: Precalculus Study Notes
Study Guide - Smart Notes
 Tailored notes based on your materials, expanded with key definitions, examples, and context.
Rectangular Coordinates and Graphs
Ordered Pairs
In mathematics, an ordered pair is a pair of numbers used to locate a point in a coordinate system. The first number represents the x-coordinate (horizontal position), and the second number represents the y-coordinate (vertical position).
Key Point: Ordered pairs are written as (x, y).
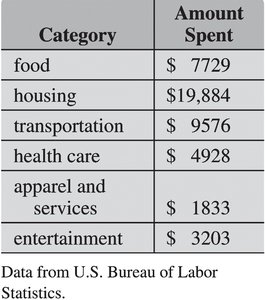
Example: The table below shows spending categories and amounts, which can be written as ordered pairs (category, amount).
Category | Amount Spent |
|---|---|
food | $7729 |
housing | $19,884 |
transportation | $9576 |
health care | $4928 |
apparel and services | $1833 |
entertainment | $3203 |
The Rectangular Coordinate System
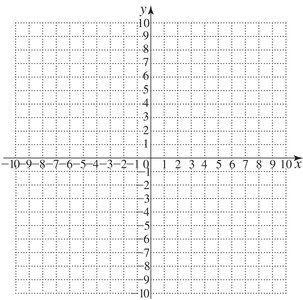
The rectangular (Cartesian) coordinate system consists of two perpendicular axes: the x-axis (horizontal) and the y-axis (vertical). The intersection point is called the origin (0, 0). The axes divide the plane into four quadrants.
Key Point: The coordinate plane is used to graph equations and visualize relationships between variables.
Example: The graph below shows the coordinate plane with labeled axes and quadrants.
⑥r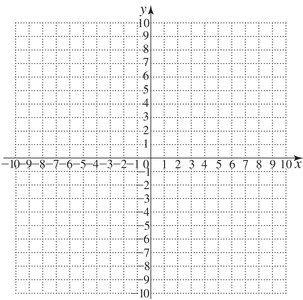
The Distance Formula
The distance formula calculates the distance between two points (x1, y1) and (x2, y2) in the coordinate plane:
Formula:
Key Point: This formula is derived from the Pythagorean Theorem.
Example: Find the distance between P(8, 4) and Q(3, -2):
The Midpoint Formula
The midpoint formula finds the point exactly halfway between two points (x1, y1) and (x2, y2):
Formula:
Key Point: The midpoint is the average of the x-coordinates and y-coordinates.
Example: Find the midpoint between (8, -4) and (-6, 1):
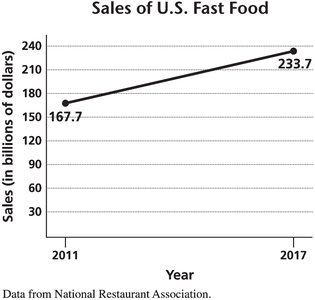
Application Example: The midpoint formula can estimate values between two data points, such as sales revenue in intermediate years.
Equations in Two Variables
An equation in two variables (such as y = 4x - 1) describes a relationship between x and y. Solutions are ordered pairs (x, y) that satisfy the equation.
Key Point: To graph an equation, plot several ordered pairs and connect them smoothly.
Example: The graph below shows the equation y = 4x - 1.
Circles
Center-Radius Form
A circle is the set of all points in a plane that are a fixed distance (radius) from a fixed point (center). The center-radius form of a circle's equation is:
Formula:
Key Point: (h, k) is the center; r is the radius.
Example: Center (-3, 4), radius 6:
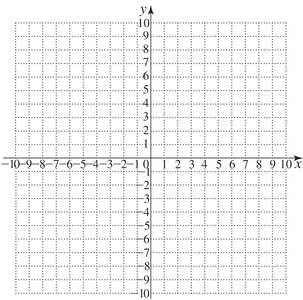
For a circle centered at the origin (0, 0):
General Form
The general form of a circle's equation is: . Completing the square can convert this to center-radius form and reveal the circle's center and radius.
Key Point: If the radius squared is negative, the graph is nonexistent; if zero, the graph is a point.
Functions
Relations and Functions
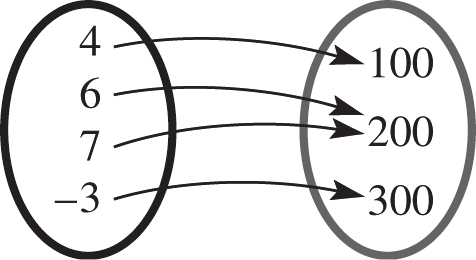
A relation is a set of ordered pairs. A function is a relation where each input (x) has exactly one output (y).
Key Point: Functions are like input-output machines: each input produces one output.
Example: The diagram below shows a relation; not all relations are functions.
Domain and Range
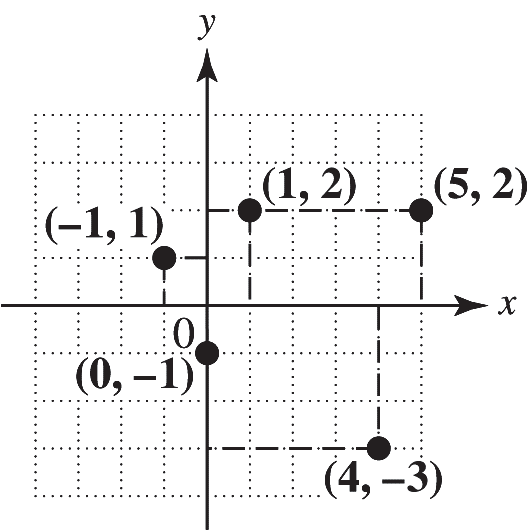
The domain of a function is the set of all possible input values (x), and the range is the set of all possible output values (y).
Key Point: Domain and range can be found from ordered pairs, tables, or graphs.
Example: The graph below illustrates domain and range.
Determining Whether Relations Are Functions
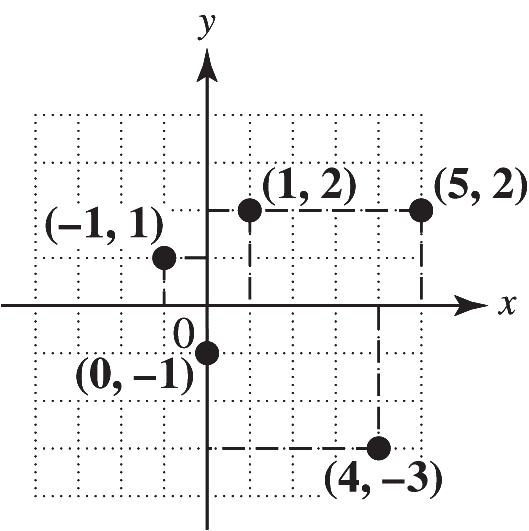
The vertical line test states that a graph represents a function if no vertical line intersects the graph at more than one point.
Key Point: This test is used to visually check if a relation is a function.
Example: The graph below passes the vertical line test.
Function Notation
Function notation uses f(x) to denote the output of function f for input x. For example, if , then .
Key Point: f(x) is not multiplication; it is the value of the function at x.
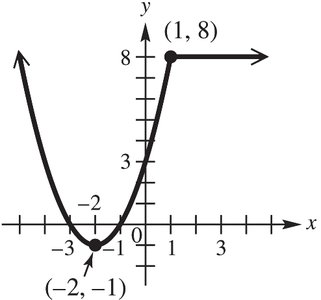
Increasing, Decreasing, and Constant Functions
A function is increasing if its output rises as x increases, decreasing if its output falls, and constant if its output stays the same.
Key Point: These behaviors are determined over intervals, not at individual points.
Example: The graph below shows intervals where a function is increasing, decreasing, or constant.
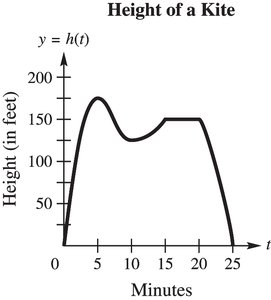
Application Example: The height of a kite as a function of time can be analyzed for maximum, minimum, and intervals of increase or decrease.
Graphs of Basic Functions
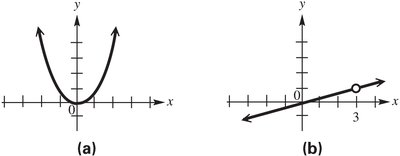
Continuity
A function is continuous if its graph can be drawn without lifting the pencil. Discontinuities are points where the graph breaks.
Key Point: Most basic functions are continuous on their domains.
Example: The graph below shows intervals of continuity.
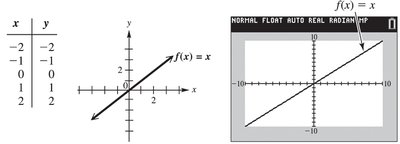
Identity, Squaring, and Cubing Functions
Identity Function: Domain: Range: $(-\infty, \infty)$
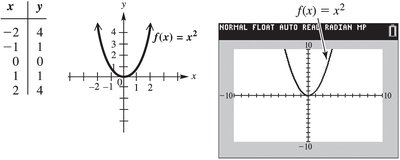
Squaring Function: Domain: Range:
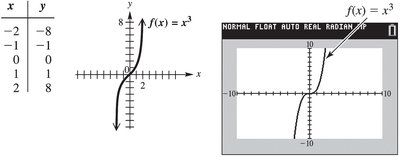
Cubing Function: Domain: Range: $(-\infty, \infty)$
Square Root and Cube Root Functions
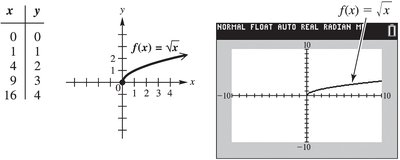
Square Root Function: Domain: Range: $[0, \infty)$
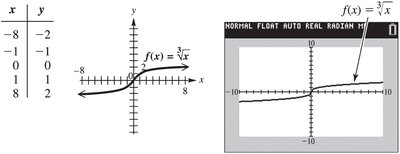
Cube Root Function: Domain: Range: $(-\infty, \infty)$
Absolute Value Function
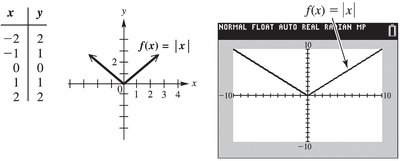
The absolute value function is defined as . It is always non-negative and forms a 'V' shape on the graph.
Domain:
Range:
Example: The graph below shows the absolute value function.
Piecewise-Defined Functions
A piecewise-defined function uses different expressions for different intervals of the domain.
Example: The graph below shows a piecewise-defined function.
Graphing Techniques
Stretching and Shrinking
Graphs can be stretched or shrunk vertically or horizontally by multiplying the function or the variable by a constant.
Vertical Stretch: ,
Vertical Shrink: ,
Horizontal Stretch/Shrink:
Reflecting
Graphs can be reflected across axes by negating the function or the variable.
Reflection across x-axis:
Reflection across y-axis:
Symmetry
A graph is symmetric with respect to the y-axis if replacing x with -x yields the same equation. Symmetry with respect to the x-axis or origin is similarly defined.
Even and Odd Functions
Even Function: for all x (symmetric about y-axis)
Odd Function: for all x (symmetric about origin)
Translations
Graphs can be translated vertically or horizontally by adding or subtracting constants to the function or variable.
Vertical Translation:
Horizontal Translation:
Function Operations and Composition
Arithmetic Operations on Functions
Functions can be added, subtracted, multiplied, or divided. The domain of the resulting function is the intersection of the domains of the original functions (except for division, where the denominator cannot be zero).
Sum:
Difference:
Product:
Quotient: ,
The Difference Quotient
The difference quotient is used in calculus and is defined as .
Composition of Functions
The composition of functions f and g is . The domain is all x in the domain of g such that g(x) is in the domain of f.
Key Point: Composition is not commutative: in general.
Additional info: These notes cover foundational Precalculus concepts including coordinate systems, graphing, functions, and operations, with relevant examples and images to reinforce understanding.
