 Back
BackGraphs of Other Trigonometric Functions
Study Guide - Smart Notes
 Tailored notes based on your materials, expanded with key definitions, examples, and context.
Chapter 4: Trigonometric Functions
4.6 Graphs of Other Trigonometric Functions
This section explores the graphs and properties of the tangent, cotangent, cosecant, and secant functions. Understanding these graphs is essential for analyzing periodic phenomena and solving trigonometric equations in precalculus.
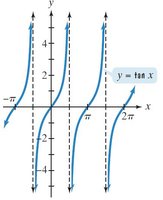
The Graph of y = tan x
Definition and Properties
Tangent Function: The tangent function is defined as .
Odd Function: .
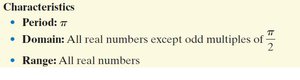
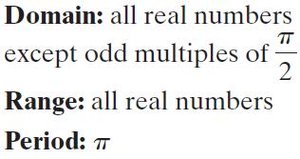
Periodicity: The period of the tangent function is .
Vertical Asymptotes: Occur at , where is any integer.
Domain: All real numbers except odd multiples of .
Range: All real numbers .
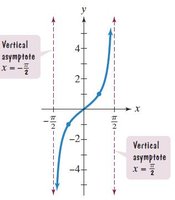

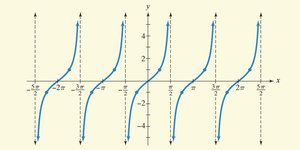
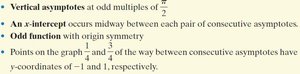
Vertical Asymptotes: At odd multiples of .
x-intercept: Occurs midway between each pair of consecutive asymptotes.
Odd function: The graph is symmetric about the origin.
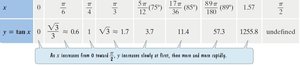
Key Points: At and of the way between asymptotes, the y-coordinates are and $1$, respectively.
Graphing Variations of y = tan x
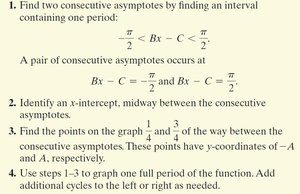
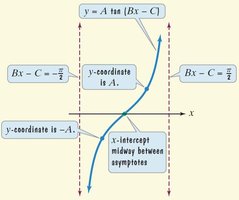
To graph , follow these steps:
Find two consecutive asymptotes by solving , so asymptotes occur at and .
Identify the x-intercept, which is midway between the asymptotes.
Find points at and of the way between asymptotes, with y-coordinates and .
Use these points to sketch one period, then repeat for additional cycles as needed.
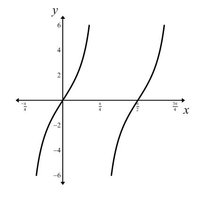
Example: Graphing a Tangent Function
Follow the four-step process above to graph a specific tangent function, such as . Identify asymptotes, x-intercept, and key points, then sketch the curve.
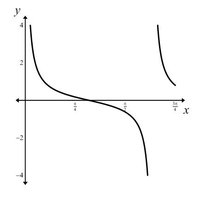
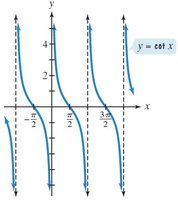
The Graph of y = cot x
Definition and Properties
Cotangent Function: .
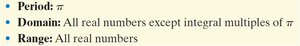
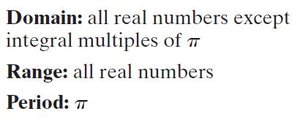
Periodicity: The period is .
Vertical Asymptotes: Occur at , where is any integer.
Domain: All real numbers except integer multiples of .
Range: All real numbers .

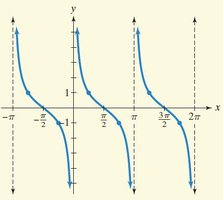
Vertical Asymptotes: At integer multiples of .
x-intercept: Occurs midway between each pair of consecutive asymptotes.
Odd function: The graph is symmetric about the origin.
Key Points: At of the way between asymptotes, the y-coordinates are $1$ and $-1$, respectively.
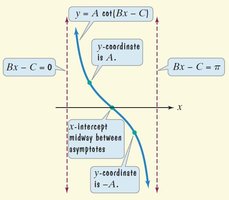
Graphing Variations of y = cot x
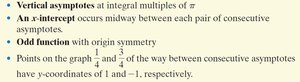
To graph , follow these steps:
Find two consecutive asymptotes by solving , so asymptotes occur at and .
Identify the x-intercept, which is midway between the asymptotes.
Find points at and of the way between asymptotes, with y-coordinates and .
Use these points to sketch one period, then repeat for additional cycles as needed.
Example: Graphing a Cotangent Function
Follow the four-step process above to graph a specific cotangent function, such as . Identify asymptotes, x-intercept, and key points, then sketch the curve.
The Graphs of y = csc x and y = sec x
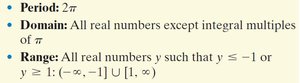
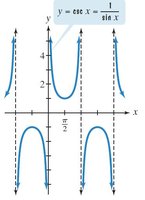
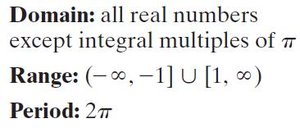
Cosecant Function: y = csc x
Definition: .
Periodicity: The period is .
Vertical Asymptotes: Occur at , where is any integer.
Domain: All real numbers except integer multiples of .
Range: .

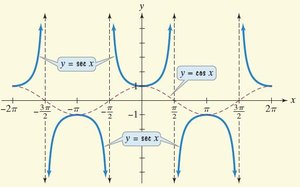
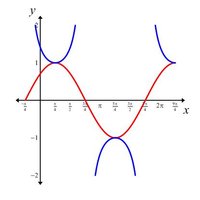
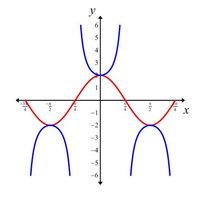
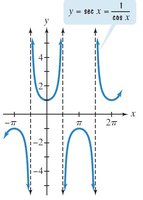
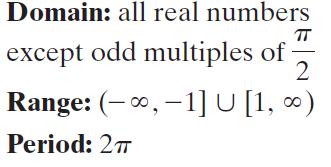
Secant Function: y = sec x
Definition: .
Periodicity: The period is .
Vertical Asymptotes: Occur at , where is any integer.
Domain: All real numbers except odd multiples of .
Range: .
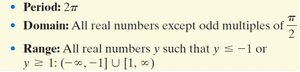

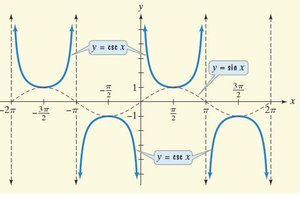
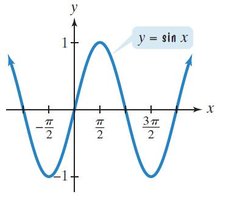
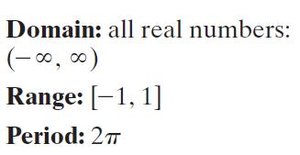
Example: Using a Sine Curve to Obtain a Cosecant Curve
To graph , first graph . The vertical asymptotes of $y = \csc x$ occur where $y = \sin x$ crosses the x-axis. The branches of $y = \csc x$ are above and below the maximum and minimum points of $y = \sin x$.
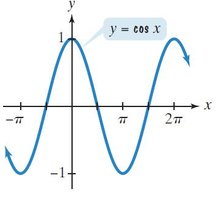
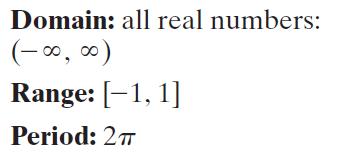
Example: Graphing a Secant Function
To graph , first graph . The vertical asymptotes of $y = \sec x$ occur where $y = \cos x$ crosses the x-axis. The branches of $y = \sec x$ are above and below the maximum and minimum points of $y = \cos x$.
The Six Curves of Trigonometry
The six fundamental trigonometric functions are: sine, cosine, tangent, cotangent, secant, and cosecant. Each has a unique graph, domain, range, and set of asymptotes. Understanding their similarities and differences is crucial for solving trigonometric equations and modeling periodic phenomena.
Summary Table: Properties of Trigonometric Functions
Function | Domain | Range | Period | Vertical Asymptotes |
|---|---|---|---|---|
None | ||||
None | ||||
All real numbers except | ||||
All real numbers except | ||||
All real numbers except | ||||
All real numbers except |
