 Back
BackGraphs of Sine and Cosine Functions (Precalculus Essentials, Ch. 4.5)
Study Guide - Smart Notes
 Tailored notes based on your materials, expanded with key definitions, examples, and context.
Graphs of Sine and Cosine Functions
Introduction
This section explores the graphical behavior of the sine and cosine functions, including their basic properties, transformations, and applications in modeling periodic phenomena. Understanding these graphs is essential for analyzing trigonometric functions and their real-world uses.
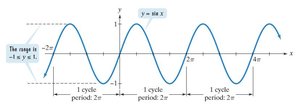
The Graph of y = sin x
Basic Properties
Domain: All real numbers,
Range:
Period: (the function repeats every units)
Amplitude: 1 (the maximum distance from the midline to the peak)
Key Points: The sine curve passes through the origin and has intercepts at integer multiples of .
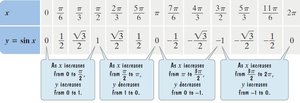

Graphing y = sin x
The graph is a smooth, continuous wave (sinusoidal curve).
One cycle starts at , rises to , returns to , falls to , and returns to .
Graphing Variations of y = sin x
General Steps
Identify amplitude and period: For , amplitude is , period is .
Find five key points: Start at the beginning of the cycle and add quarter-periods () to find the next points.
Evaluate function at key points: Calculate -values for each .
Draw the curve: Connect the points smoothly to form one cycle.
Extend as needed: Repeat the pattern to the left or right.
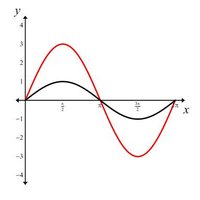
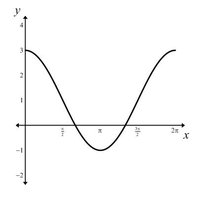
Example: Graphing y = 3\sin x
Amplitude: 3
Period:
Key Points: , , , ,
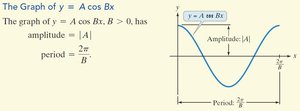
Amplitudes and Periods
Definitions
Amplitude: in or
Period:
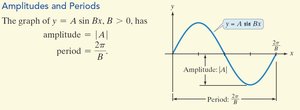
Graphing y = A\sin(Bx)
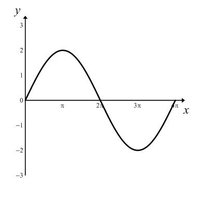
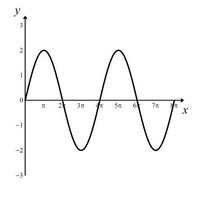
Example: y = 2\sin(2x)
Amplitude: 2
Period:
Key Points: , , , ,
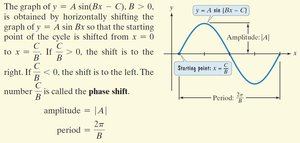
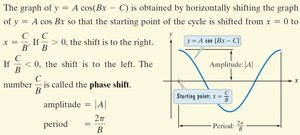
Graphing y = A\sin(Bx - C)
Phase Shift
The graph is shifted horizontally by units.
If , shift is to the right; if , shift is to the left.
Formula:
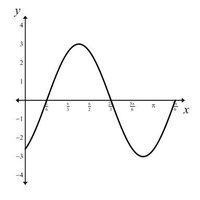
Example: y = 3\sin(2x - \frac{\pi}{2})
Amplitude: 3
Period:
Phase Shift: to the right
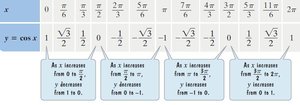
The Graph of y = cos x
Basic Properties
Domain: All real numbers
Range:
Period:
Amplitude: 1
Key Points: , , , ,
Sinusoidal Graphs
Definition
Both sine and cosine graphs are called sinusoidal graphs because of their wave-like, periodic nature.
Graphing Variations of y = cos x
General Steps
Identify amplitude and period.
Find five key points (start at maximum, then quarter-periods).
Evaluate function at key points.
Draw the curve for one cycle.
Extend as needed.
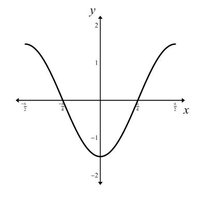
Example: y = 4\cos(\pi x)
Amplitude: 4
Period:
Key Points: , , , ,
Graphing y = A\cos(Bx - C)
Phase Shift
The graph is shifted horizontally by units.
Same rules for direction as sine.
Vertical Shifts of Sinusoidal Graphs
Definition
Adding a constant to or shifts the graph vertically by units.
Upward if , downward if .
Example: y = 2\sin x + 1
The midline is now instead of .
Modeling Periodic Behavior
Application Example: Daylight Hours
Periodic phenomena, such as daylight hours throughout the year, can be modeled using sinusoidal functions.
General form:
Amplitude (A): Half the difference between maximum and minimum values.
Vertical Shift (D): The average of the maximum and minimum values.
Period (B): Determined by the length of one cycle (e.g., 12 months for a year: ).
Phase Shift (C): Adjusted to match the timing of maximum or minimum values.
Example: If daylight hours range from 10 to 14, the midline is 12, amplitude is 2, and period is 12 months. The function is .
