 Back
BackGraphs of Sine and Cosine Functions: Amplitude, Period, and Transformations
Study Guide - Smart Notes
 Tailored notes based on your materials, expanded with key definitions, examples, and context.
Trigonometric Functions
Graphs of the Sine and Cosine Functions
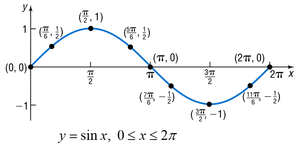
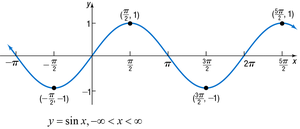
The sine and cosine functions are fundamental periodic functions in trigonometry, widely used to model oscillatory phenomena. Their graphs exhibit regular patterns characterized by amplitude, period, and symmetry properties.
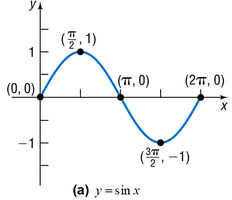
Properties of the Sine Function
Domain: All real numbers ().
Range: .
Odd Function: Symmetric about the origin; .
Periodicity: Period is ; .
x-intercepts: , where is an integer.
y-intercept: at .
Maximum value: $1x = \frac{\pi}{2} + 2n\pi$.
Minimum value: at .
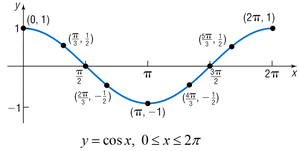
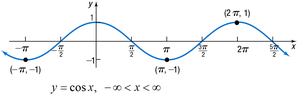
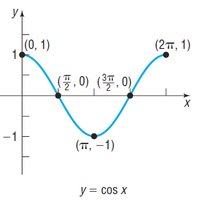
Properties of the Cosine Function
Domain: All real numbers ().
Range: .
Even Function: Symmetric about the y-axis; .
Periodicity: Period is ; .
x-intercepts: , where is an integer.
y-intercept: at .
Maximum value: $1x = 2n\pi$.
Minimum value: at .
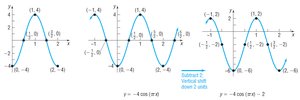
Transformations of Sine and Cosine Functions
Transformations modify the basic sine and cosine graphs by changing their amplitude, period, and orientation. The general forms are:
Sine:
Cosine:
Where:
A is the amplitude (vertical stretch/shrink).
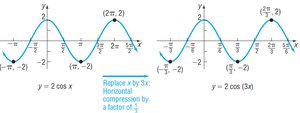
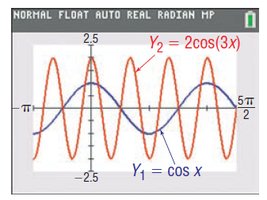
\omega affects the period (horizontal stretch/compression).
The period is given by .
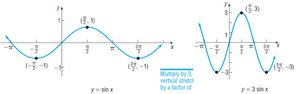
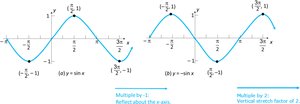
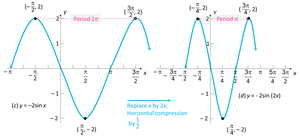
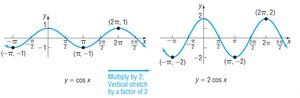
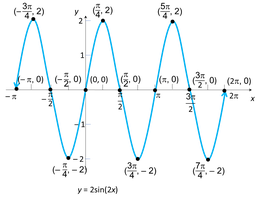
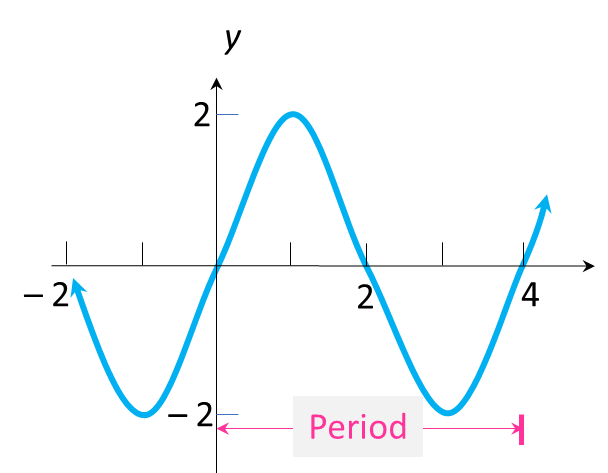
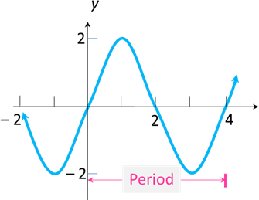
Amplitude and Period of Sinusoidal Functions
The amplitude and period are key characteristics of sinusoidal functions. Amplitude measures the height from the midline to the peak, while period measures the length of one complete cycle.
Amplitude:
Period:
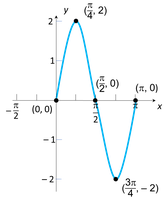
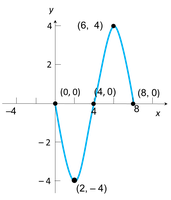
Graphing Sinusoidal Functions Using Key Points
To graph a sinusoidal function, identify five key points within one period, plot them, and extend the graph. The steps are:
Determine amplitude and period.
Divide the interval for one period into four equal subintervals.
Calculate the y-values for the five key points.
Plot the points and draw the curve.


Finding an Equation for a Sinusoidal Graph
To find the equation for a given sinusoidal graph, identify the amplitude, period, and phase shift. Use the general form:
or
Where is amplitude, determines period, and is phase shift.
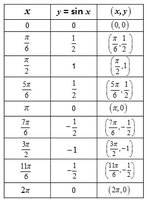
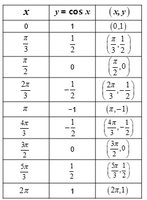
Summary Table: Key Points for Sine and Cosine Functions
The following tables summarize the key points for the sine and cosine functions over one period:
x | y = sin x | (x, y) |
|---|---|---|
0 | 0 | (0, 0) |
\frac{\pi}{6} | \frac{1}{2} | (\frac{\pi}{6}, \frac{1}{2}) |
\frac{\pi}{2} | 1 | (\frac{\pi}{2}, 1) |
\frac{5\pi}{6} | \frac{1}{2} | (\frac{5\pi}{6}, \frac{1}{2}) |
\pi | 0 | (\pi, 0) |
\frac{7\pi}{6} | -\frac{1}{2} | (\frac{7\pi}{6}, -\frac{1}{2}) |
\frac{3\pi}{2} | -1 | (\frac{3\pi}{2}, -1) |
\frac{11\pi}{6} | -\frac{1}{2} | (\frac{11\pi}{6}, -\frac{1}{2}) |
2\pi | 0 | (2\pi, 0) |
x | y = cos x | (x, y) |
|---|---|---|
0 | 1 | (0, 1) |
\frac{\pi}{3} | \frac{1}{2} | (\frac{\pi}{3}, \frac{1}{2}) |
\frac{\pi}{2} | 0 | (\frac{\pi}{2}, 0) |
\frac{2\pi}{3} | -\frac{1}{2} | (\frac{2\pi}{3}, -\frac{1}{2}) |
\pi | -1 | (\pi, -1) |
\frac{4\pi}{3} | -\frac{1}{2} | (\frac{4\pi}{3}, -\frac{1}{2}) |
\frac{3\pi}{2} | 0 | (\frac{3\pi}{2}, 0) |
\frac{5\pi}{3} | \frac{1}{2} | (\frac{5\pi}{3}, \frac{1}{2}) |
2\pi | 1 | (2\pi, 1) |
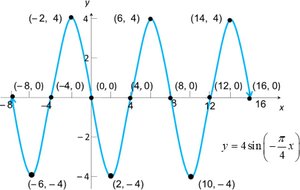
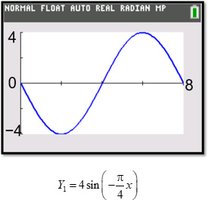
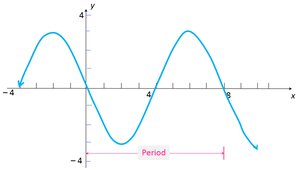
Example: The function has amplitude $4T = \frac{2\pi}{\frac{\pi}{4}} = 8-4 and completes one cycle every $8$ units along the x-axis.
Additional info: The notes above expand on the original content by providing definitions, formulas, and step-by-step procedures for graphing and analyzing sinusoidal functions, ensuring completeness and academic clarity for precalculus students.
