 Back
Back9.3 Graphs of Sine and Cosine Functions: Periodic Behavior, Transformations, and Applications
Study Guide - Smart Notes
 Tailored notes based on your materials, expanded with key definitions, examples, and context.
Ch 9.3 Graphs of the Sine and Cosine Functions
Periodic Functions
Many phenomena in mathematics and nature exhibit repeating patterns. Sine and cosine functions are classic examples of periodic functions, which repeat their values at regular intervals.
Definition: A function f is periodic if for every real number x, every integer n, and some positive real number p.
Period: The smallest positive value of p for which the function repeats is called the period.
Example: The sine and cosine functions both have period .
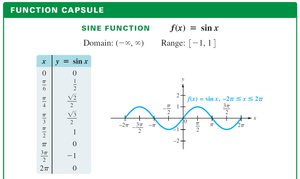
Sine Function: Properties and Graph
The sine function is defined for all real numbers and exhibits a smooth, wave-like graph.
Domain:
Range:
X-intercepts: At , where is an integer
Period:
Symmetry: Odd function, symmetric about the origin
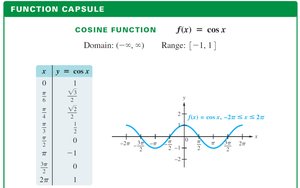
Cosine Function: Properties and Graph
The cosine function is similar to the sine function but starts at its maximum value.
Domain:
Range:
X-intercepts: At , where is an integer
Period:
Symmetry: Even function, symmetric about the y-axis
Transformations of Sine and Cosine Functions
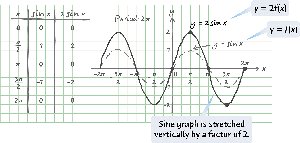
Vertical Stretch and Amplitude
Multiplying the sine or cosine function by a constant changes the height of the graph, known as the amplitude.
Amplitude: For or , the amplitude is .
Range:
Example: has amplitude 2 and range .
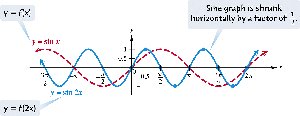
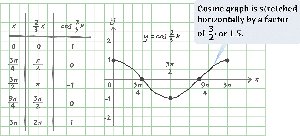
Horizontal Compression/Expansion and Period
Changing the coefficient of x in or alters the period of the function.
Period Formula:
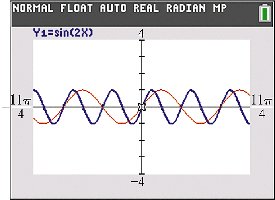
Example: has period (half the standard period).
Graphing Sine and Cosine with Different Periods
To graph or , follow these steps:
Find the period:
Divide the interval into four equal parts
Evaluate the function at five key points
Plot and connect the points with a smooth curve
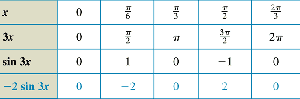
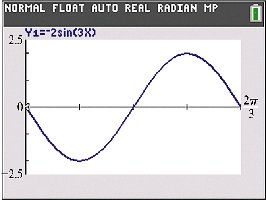
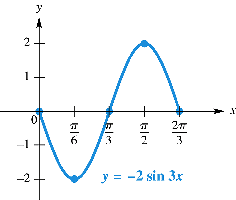
Graphing y = a sin bx: Negative Amplitude
When a is negative, the graph is reflected across the x-axis.
Example: is a reflection of .
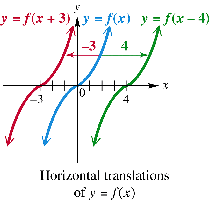
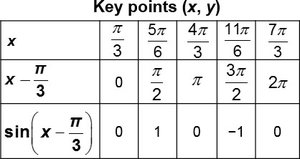
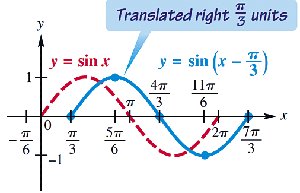
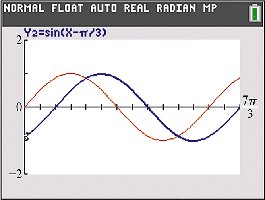
Horizontal Translations (Phase Shift)
Shifting the graph horizontally is called a phase shift. The expression in or moves the graph d units right if d is positive, left if negative.
Phase Shift: is shifted d units right.
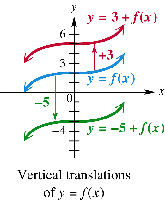
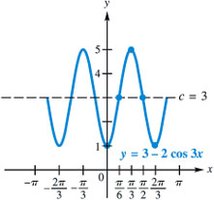
Vertical Translations
Adding a constant c to the function moves the graph vertically. shifts the graph c units up if c is positive, down if negative.
Example: is shifted up by 3 units.
General Form and Guidelines for Graphing
General Sinusoidal Function
The most general form is or , where:
a: Amplitude
b: Frequency (affects period)
c: Vertical shift
d: Phase shift
Guidelines:
Find the interval for one period by solving
Divide the interval into four equal parts
Evaluate the function at five key points
Plot and connect the points
Extend the graph as needed
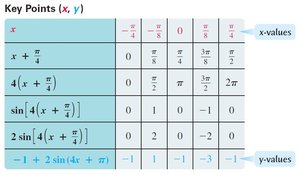
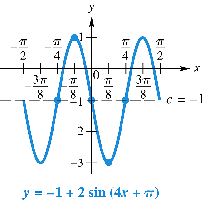
Example: Graphing y = -1 + 2 sin(4x + π)
To graph :
Express in standard form:
Find period:
Divide interval into four parts
Calculate key points
Applications: Modeling with Sine Functions
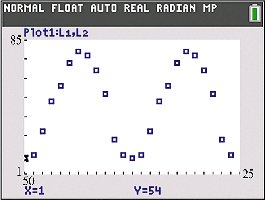
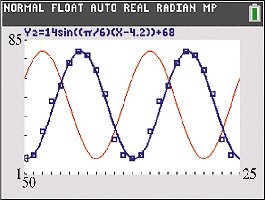
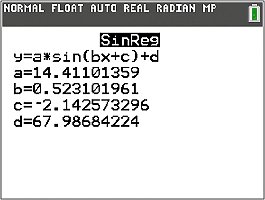
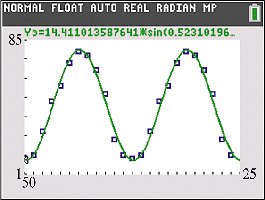
Modeling Temperature Data
Sine functions can model real-world periodic phenomena, such as temperature variations.
Example: Maximum monthly average temperature in New Orleans is 82°F, minimum is 54°F.
Amplitude:
Vertical shift:
Period: 12 months, so
Phase shift: Determined by data, trial and error gives
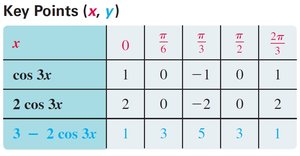
Summary Table: Key Points for Sinusoidal Functions
Tables are useful for organizing key values when graphing transformed sine and cosine functions.
x | Function Value | Transformed Value |
|---|---|---|
0 | sin(0) | 0 |
sin() | 1 | |
sin() | 0 | |
sin() | -1 | |
sin() | 0 |
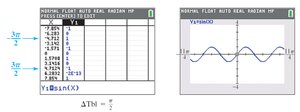
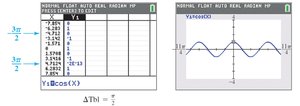
Additional info: Tables for more complex transformations (e.g., , , ) are included in the images above.
