 Back
BackGraphs of Sine and Cosine Functions: Properties, Variations, and Transformations
Study Guide - Smart Notes
 Tailored notes based on your materials, expanded with key definitions, examples, and context.
Graphs of Sine and Cosine Functions
Introduction
The sine and cosine functions are fundamental periodic functions in trigonometry. Their graphs, called sinusoidal graphs, are widely used to model periodic phenomena in mathematics, physics, and engineering. This section explores the properties, variations, and transformations of these graphs.
y = sin x: Properties and Graph
Key Properties of y = sin x
Domain:
Range:
Period:
Odd Function:
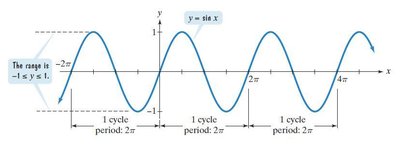
The sine function completes one full cycle over an interval of radians. The graph oscillates smoothly between -1 and 1.
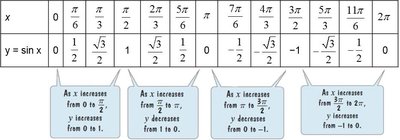

Key Points and Behavior
At ,
At , (maximum)
At ,
At , (minimum)
At ,
Graphing Variations of y = sin x
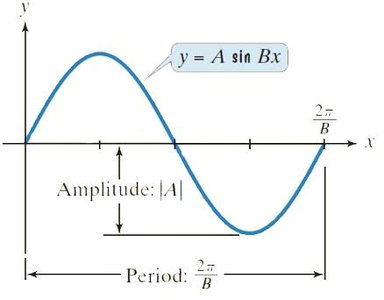
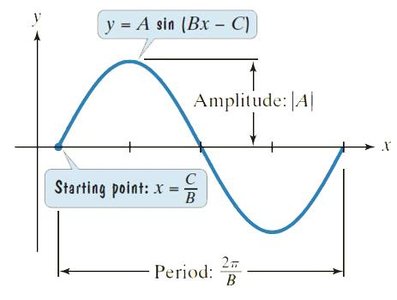
General Form:
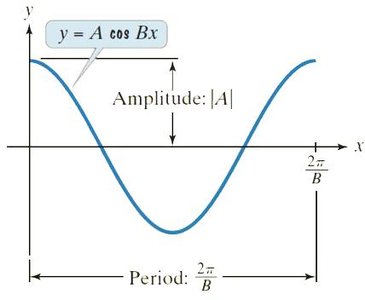
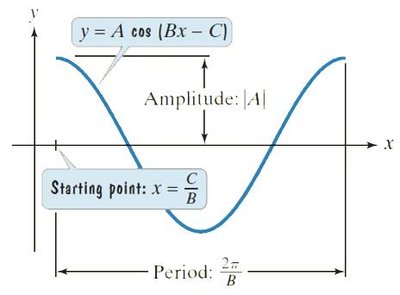
Variations of the sine function involve changes in amplitude and period. The general form is , where:
Amplitude: (vertical stretch or shrink)
Period: (horizontal stretch or shrink)
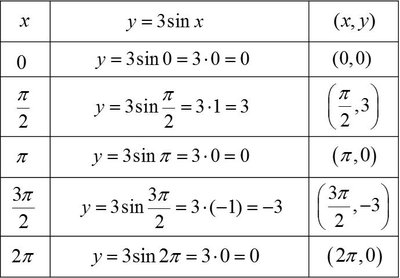
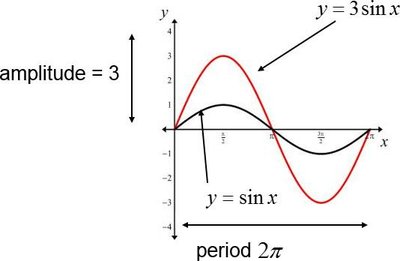
Example:
Amplitude: 3
Period:
The graph oscillates between -3 and 3, with the same period as .
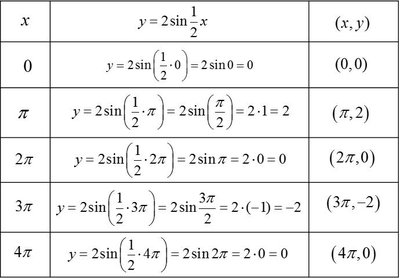
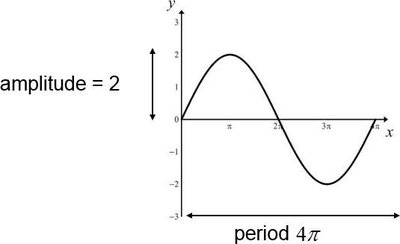
Example:
Amplitude: 2
Period:
The graph stretches horizontally, completing one cycle over units.
Phase Shift:
Horizontal Shifts (Phase Shift)
The function shifts the graph horizontally by units. If , the shift is to the right; if , the shift is to the left.
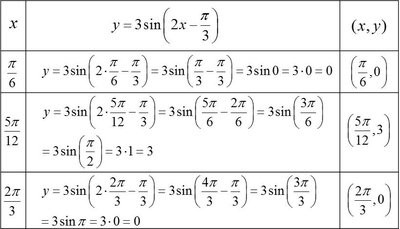
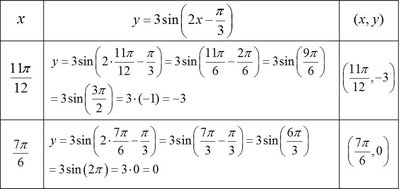
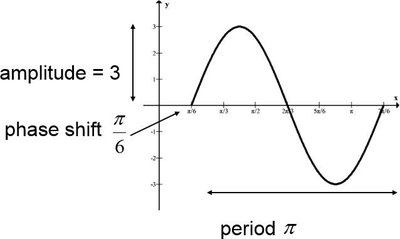
Example:
Amplitude: 3
Period:
Phase Shift: to the right
y = cos x: Properties and Graph
Key Properties of y = cos x
Domain:
Range:
Period:
Even Function:
Example:
Amplitude: 4
Period:
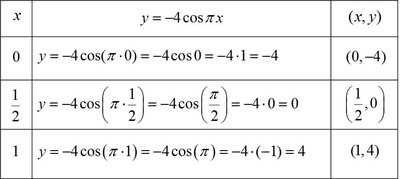
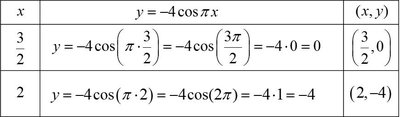
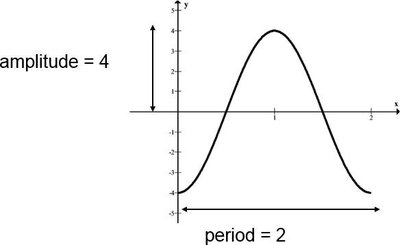
Phase Shift:
Horizontal Shifts (Phase Shift)
The function shifts the graph horizontally by units. The amplitude and period are determined as before.
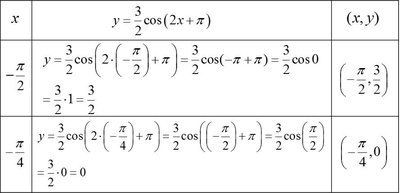
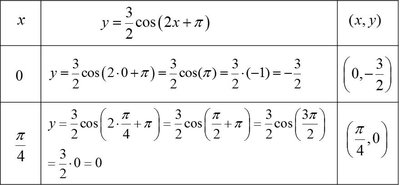
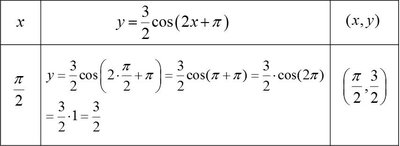
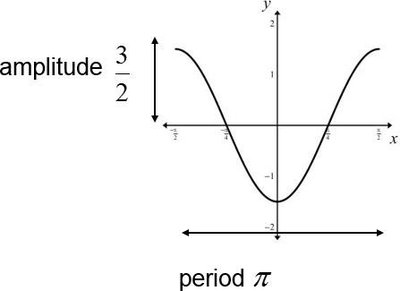
Example:
Amplitude:
Period:
Phase Shift: (to the left)
Vertical Shifts of Sinusoidal Graphs
General Form: or
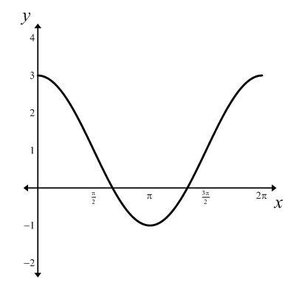
The constant causes a vertical shift in the graph. The sinusoidal graph oscillates about the line instead of the x-axis.
Maximum value:
Minimum value:
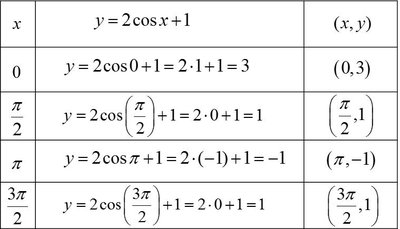
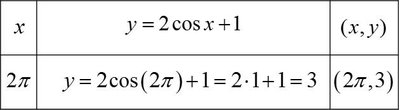
Example:
Amplitude: 2
Period:
Vertical shift: 1 unit upward
Summary Table: Properties of Sine and Cosine Functions
Function | Amplitude | Period | Phase Shift | Vertical Shift | Range |
|---|---|---|---|---|---|
Additional info: Sinusoidal graphs are used to model periodic phenomena such as sound waves, tides, and seasonal temperatures. Understanding their transformations is essential for analyzing real-world periodic behavior.
