 Back
Back9.4 Graphs of the Other Circular Functions: Secant, Cosecant, Tangent, and Cotangent
Study Guide - Smart Notes
 Tailored notes based on your materials, expanded with key definitions, examples, and context.
9.4 Graphs of the Other Circular Functions
Cosecant and Secant Functions
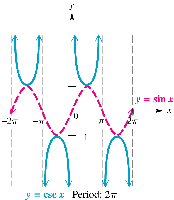
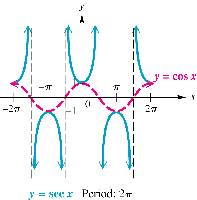
The cosecant and secant functions are the reciprocals of the sine and cosine functions, respectively. Their graphs exhibit unique properties, including vertical asymptotes and discontinuities, which arise where the corresponding sine or cosine values are zero.
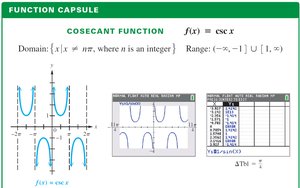
Cosecant Function (y = csc x): The values of csc x are the reciprocals of sin x. Where sin x = 0, csc x is undefined, resulting in vertical asymptotes at those points (x = nπ, where n is an integer).
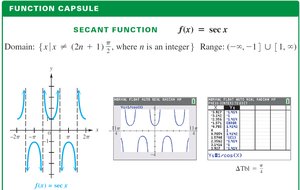
Secant Function (y = sec x): The values of sec x are the reciprocals of cos x. Where cos x = 0, sec x is undefined, resulting in vertical asymptotes at those points (x = (2n+1)π/2, where n is an integer).
Both functions have a period of 2π and are discontinuous at their vertical asymptotes.
Neither function has x-intercepts, and their graphs have no amplitude since they do not attain maximum or minimum values in the traditional sense.
The secant function is an even function (symmetric about the y-axis), while the cosecant function is an odd function (symmetric about the origin).
Key Properties of Secant and Cosecant Functions
Function | Domain | Range | Period | Symmetry |
|---|---|---|---|---|
y = sec x | {x | x ≠ (2n+1)π/2, n ∈ ℤ} | (−∞, −1] ∪ [1, ∞) | 2π | Even |
y = csc x | {x | x ≠ nπ, n ∈ ℤ} | (−∞, −1] ∪ [1, ∞) | 2π | Odd |
Guidelines for Sketching Secant and Cosecant Graphs
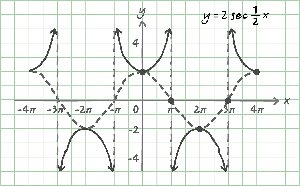
To graph y = a sec bx or y = a csc bx (with b > 0):
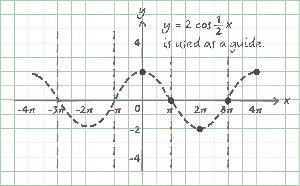
Graph the corresponding reciprocal function (cosine for secant, sine for cosecant) as a guide.
Sketch vertical asymptotes at the x-intercepts of the guide function.
Draw the U-shaped branches of the secant or cosecant function between the asymptotes. The branches are above the guide function when it is positive and below when it is negative.
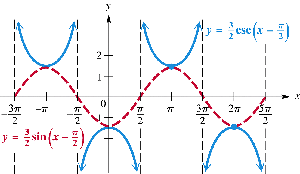
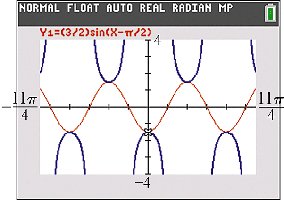
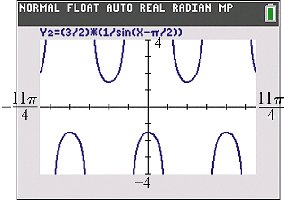
Graphing y = a csc(x – d)
To graph y = a csc(x – d):
First, graph the corresponding sine function y = a sin(x – d) as a guide.
The amplitude and phase shift are determined by the coefficients a and d, respectively.
The vertical asymptotes of the cosecant graph occur at the x-intercepts of the guide sine function.
Graphs of the Tangent and Cotangent Functions
Properties and Graphing Guidelines
The tangent and cotangent functions are periodic and have unique graphs characterized by vertical asymptotes and the absence of amplitude.
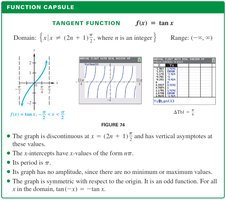
Tangent Function (y = tan x): Has vertical asymptotes at x = (2n+1)π/2, period π, and is an odd function (symmetric about the origin).
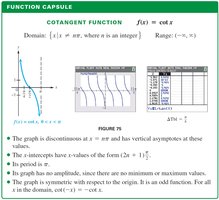
Cotangent Function (y = cot x): Has vertical asymptotes at x = nπ, period π, and is also an odd function.
Both functions are discontinuous at their vertical asymptotes and have no maximum or minimum values.
Function | Domain | Range | Period | Symmetry |
|---|---|---|---|---|
y = tan x | {x | x ≠ (2n+1)π/2, n ∈ ℤ} | (−∞, ∞) | π | Odd |
y = cot x | {x | x ≠ nπ, n ∈ ℤ} | (−∞, ∞) | π | Odd |
Steps for Graphing Tangent and Cotangent Functions
Determine the period: For y = a tan bx or y = a cot bx, the period is .
Locate two adjacent vertical asymptotes by solving bx = and bx = for tangent, or bx = 0 and bx = for cotangent.
Divide the interval between asymptotes into four equal parts to find key points.
Plot the function at these points and sketch the curve approaching the asymptotes.
Graphing Examples
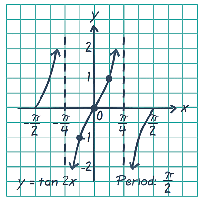
y = tan 2x: The period is . Vertical asymptotes are at and .
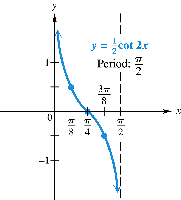
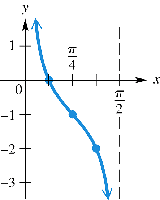
y = \frac{1}{2} \cot 2x: The period is . Vertical asymptotes are at and .
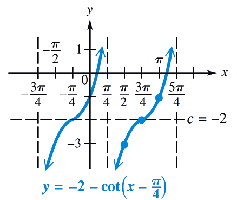
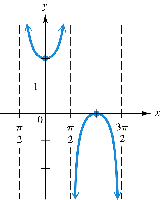
y = -2 - \cot(x - \frac{\pi}{4}): The graph is reflected, shifted right by , and down by 2 units.
Determining Equations from Graphs
Identifying Transformations
To determine the equation of a trigonometric graph, analyze the period, amplitude, phase shift, vertical translation, and reflection.
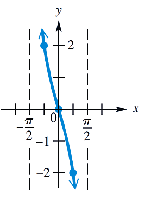
If the graph is a reflection of y = tan x and vertically stretched by 2, the equation is y = -2 tan x.
If the graph is a cotangent function with period and shifted down by 1, the equation is y = cot 2x - 1.
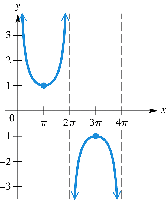
If the graph is a cosecant function with period 4π, then y = csc(\frac{1}{2}x).
If the graph is y = sec x translated up by 1, the equation is y = 1 + sec x.
Summary Table: Properties of Circular Functions
Function | Domain | Range | Period | Symmetry | Vertical Asymptotes |
|---|---|---|---|---|---|
y = sec x | {x | x ≠ (2n+1)π/2} | (−∞, −1] ∪ [1, ∞) | 2π | Even | x = (2n+1)π/2 |
y = csc x | {x | x ≠ nπ} | (−∞, −1] ∪ [1, ∞) | 2π | Odd | x = nπ |
y = tan x | {x | x ≠ (2n+1)π/2} | (−∞, ∞) | π | Odd | x = (2n+1)π/2 |
y = cot x | {x | x ≠ nπ} | (−∞, ∞) | π | Odd | x = nπ |
Additional info: The above notes include expanded academic context and examples to ensure completeness and clarity for precalculus students.
