 Back
BackGraphs of Transformed Sine and Cosine Functions: Precalculus Study Guide
Study Guide - Smart Notes
 Tailored notes based on your materials, expanded with key definitions, examples, and context.
Graphs of Transformed Sine and Cosine Functions
Introduction to Transformations
The graphs of sine and cosine functions can be transformed by changing their amplitude, period, phase shift, and vertical translation. These transformations are represented in the general forms: and , where A, B, C, and D are constants that affect the graph in specific ways.
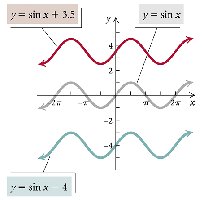
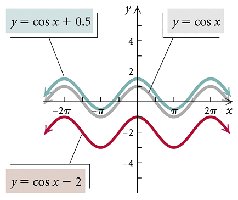
The Constant D: Vertical Translation
The constant D in the equations or translates the graph vertically. If D > 0, the graph moves up by D units; if D < 0, it moves down by D units.
Key Point: Vertical translation does not affect amplitude or period.
Example: moves the basic sine curve up by 3.5 units.
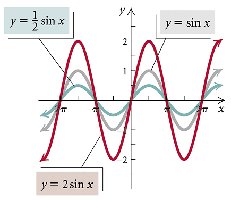
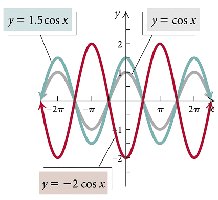
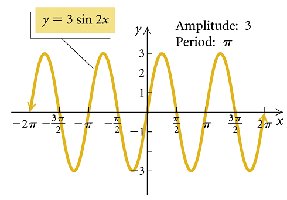
The Constant A: Amplitude and Reflection
The constant A affects the amplitude and possible reflection of the graph. The amplitude is the absolute value of A, , which determines the height of the wave from its midline.
Key Point: If A > 1, the graph is vertically stretched; if 0 < A < 1, it is vertically shrunk.
Key Point: If A < 0, the graph is reflected across the x-axis.
Formula: Amplitude =
Example: has amplitude 2; has amplitude 0.5.
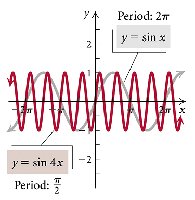
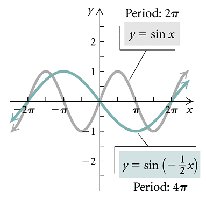
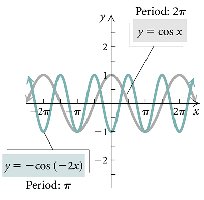
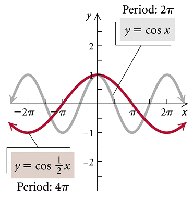
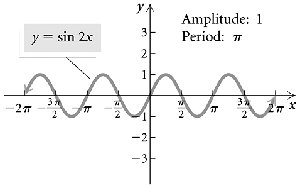
The Constant B: Period and Horizontal Stretch/Shrink
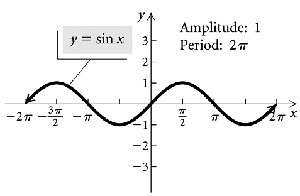
The constant B affects the period and possible reflection across the y-axis. The period is the length of one complete cycle of the wave.
Key Point: The period is calculated as for sine and cosine functions.
Key Point: If B > 1, the graph is horizontally shrunk; if 0 < B < 1, it is horizontally stretched.
Key Point: If B < 0, the graph is reflected across the y-axis.
Example: has period .
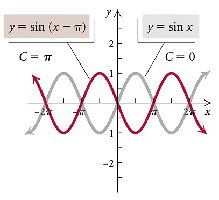
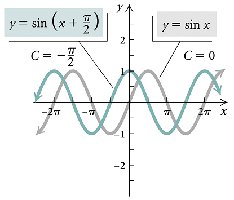
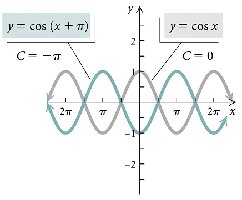
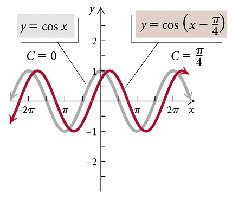
The Constant C: Phase Shift (Horizontal Translation)
The constant C causes a horizontal translation, known as the phase shift. The phase shift is calculated as , moving the graph right if the value is positive and left if negative.
Key Point: Phase shift =
Example: shifts the graph right by units.
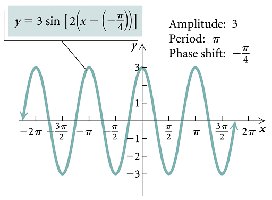
Combined Transformations and Phase Shift
When all constants are present, the function or can be rewritten to highlight the phase shift: . The phase shift is .
Key Point: The graph is translated horizontally by the phase shift, vertically by D, stretched/shrunk by A and B, and possibly reflected.
Steps for Graphing Transformed Sine and Cosine Functions
Step 1: Stretch or shrink the graph horizontally according to B. The period is .
Step 2: Stretch or shrink the graph vertically according to A. The amplitude is .
Step 3: Translate the graph horizontally according to C. The phase shift is .
Step 4: Translate the graph vertically according to D.
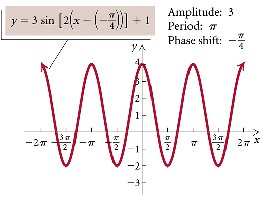
Example 1: Graphing a Transformed Sine Function
Consider . Find the amplitude, period, and phase shift.
Amplitude:
Period:
Phase Shift: units to the right
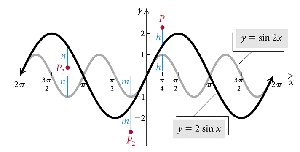
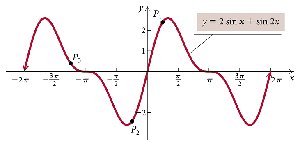
Example 2: Graphing the Sum of Functions
To graph , add the ordinates (y-values) of and at each x-value. The period of the sum is the least common multiple of the individual periods.
Key Point: Addition of ordinates is used to combine the graphs.
Example: At , add the y-values of both functions.
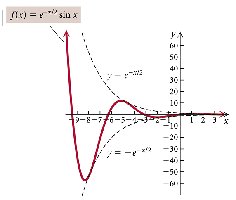
Example 3: Damped Oscillations (Product of Functions)
When a trigonometric function is multiplied by another function, such as , the resulting graph is a damped oscillation. The amplitude changes according to the multiplying function.
Key Point: The graph is constrained between the multiplying function and its negative.
Example: oscillates between and .
Summary Table: Effects of Constants on Sine and Cosine Graphs
Constant | Effect | Formula |
|---|---|---|
A | Amplitude, vertical stretch/shrink, reflection across x-axis | Amplitude = |
B | Period, horizontal stretch/shrink, reflection across y-axis | Period = |
C | Phase shift (horizontal translation) | Phase shift = |
D | Vertical translation | Up D units if D > 0, down D units if D < 0 |
Conclusion
Understanding the effects of the constants A, B, C, and D allows for accurate graphing and interpretation of transformed sine and cosine functions. These concepts are fundamental in precalculus and have applications in physics, engineering, and signal processing.
