 Back
BackIdentifying a Trigonometric Function from Its Graph
Study Guide - Smart Notes
 Tailored notes based on your materials, expanded with key definitions, examples, and context.
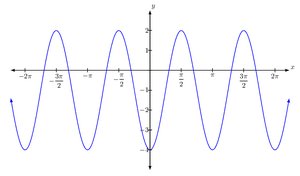
Q7. Find an equation for a trigonometric function that fits the graph:
Background
Topic: Graphs of Trigonometric Functions
This question tests your ability to analyze the graph of a trigonometric function (such as sine or cosine) and write its equation by identifying key features like amplitude, period, phase shift, and vertical shift.
Key Terms and Formulas:
Amplitude: The maximum distance from the midline to the peak (or trough) of the graph.
Period: The horizontal length of one complete cycle of the graph. For or , the period is .
Phase Shift: The horizontal shift of the graph, given by .
Vertical Shift: The amount the graph is shifted up or down, given by .
Step-by-Step Guidance
Examine the graph to determine whether it resembles a sine or cosine function. Look at where the graph starts and its symmetry.
Identify the amplitude by measuring the distance from the midline to a peak (or trough).
Determine the period by finding the horizontal distance between two consecutive peaks (or troughs), then use the formula to solve for .
Check for any vertical or phase shifts by comparing the graph's midline and starting point to the standard sine or cosine graph.
Try solving on your own before revealing the answer!
Final Answer:
The equation that fits the graph is .
This is because the graph has an amplitude of 2, a period of , and no vertical or phase shift.
