 Back
Introduction to Functions and Linear Functions
Study Guide - Smart Notes
 Tailored notes based on your materials, expanded with key definitions, examples, and context.
Functions and Their Graphs
Definition of a Function
A function is a relation that assigns to each element in a set called the domain exactly one element in a set called the range. Functions are fundamental objects in mathematics and are used to model relationships between quantities.
Domain: The set of all possible input values (usually x-values).
Range: The set of all possible output values (usually f(x) or y-values).
Notation: If f is a function, we write f: X → Y, where X is the domain and Y is the range.
Example: If f(x) = x + 2, and the domain is {1, 2, 3}, then the range is {3, 4, 5}.
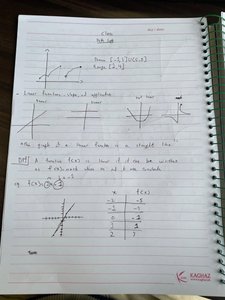
Graph of a Function
The graph of a function is the set of all points (x, f(x)) in the coordinate plane. For a function to be valid, each x-value must correspond to exactly one y-value.
The graph of a linear function is a straight line.
Other common function graphs include parabolas (quadratic functions), cubic curves, and more.
Example: The graph of f(x) = x is a straight line passing through the origin with a slope of 1.
Types of Functions
Linear Functions
A linear function is a function of the form f(x) = mx + c, where m and c are constants. The graph of a linear function is always a straight line.
Slope (m): Measures the steepness of the line.
Y-intercept (c): The point where the line crosses the y-axis.
Example: For f(x) = 2x + 1, the slope is 2 and the y-intercept is 1.
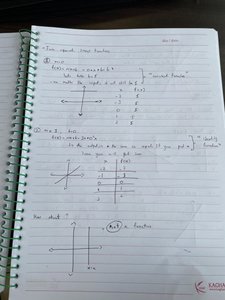
Vertical Line Test
The vertical line test is a method to determine if a graph represents a function. If any vertical line intersects the graph at more than one point, the graph does not represent a function.
If every vertical line crosses the graph at most once, it is a function.
If a vertical line crosses more than once, it is not a function.
Example: The graph of x = 2 is a vertical line and does not represent a function.
Properties of Linear Functions
Slope of a Line
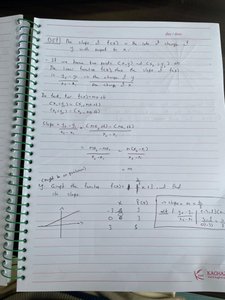
The slope of a line measures the rate of change of the function. It is calculated as the ratio of the change in y to the change in x between two points on the line.
Given two points (x1, y1) and (x2, y2), the slope m is:
If m > 0, the line rises as x increases.
If m < 0, the line falls as x increases.
If m = 0, the line is horizontal.
If the line is vertical, the slope is undefined.
Example: For points (1, 2) and (3, 6), the slope is .
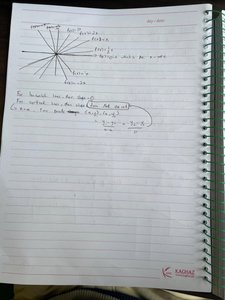
Special Cases: Vertical and Horizontal Lines
Vertical and horizontal lines are special cases of linear equations:
Vertical line: x = a (slope is undefined)
Horizontal line: y = b (slope is 0)
Example: The line x = 2 is vertical; the line y = -3 is horizontal.
Summary Table: Linear Functions and Their Properties
Type of Line | Equation | Slope | Graph |
|---|---|---|---|
General Linear | y = mx + c | m | Straight line |
Vertical | x = a | Undefined | Vertical line |
Horizontal | y = b | 0 | Horizontal line |
Additional info: These notes cover the foundational concepts of functions, their graphical representation, and the properties of linear functions, which are essential for further study in Precalculus.
