 Back
Key Concepts in Functions: Symmetry, Increasing/Decreasing Intervals, and the Difference Quotient
Study Guide - Smart Notes
 Tailored notes based on your materials, expanded with key definitions, examples, and context.
1. Domain and Range of a Function
Understanding Domain and Range
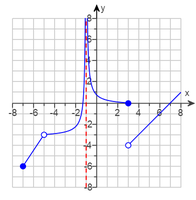
The domain of a function is the set of all possible input values (x-values) for which the function is defined. The range is the set of all possible output values (y-values) that the function can produce.
Domain: Look for any restrictions such as division by zero or square roots of negative numbers.
Range: Consider the possible y-values based on the graph or algebraic expression.
Example: For a rational function, the domain excludes values that make the denominator zero.
2. Symmetry of Functions
Types of Symmetry
Symmetry in functions helps classify their behavior and can simplify graphing and analysis. The main types are:
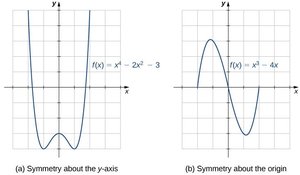
y-axis Symmetry (Even Functions): A function is even if for all x in the domain. The graph is unchanged when reflected over the y-axis.
Origin Symmetry (Odd Functions): A function is odd if for all x in the domain. The graph is unchanged when rotated 180° about the origin.
x-axis Symmetry: Not possible for functions (would fail the vertical line test), but possible for general relations.
y = x Symmetry: The graph is unchanged when reflected over the line y = x. This is common for inverse functions.
Testing for Symmetry Algebraically
Replace x with -x in the function and compare to the original.
If , the function is even (y-axis symmetry).
If , the function is odd (origin symmetry).
If neither, the function is neither even nor odd.
Example: is even, is odd, is neither.
Generalizations for Polynomials
If all exponents are even, the polynomial is even.
If all exponents are odd and there is no constant term, the polynomial is odd.
If there is a mix of even and odd exponents, the polynomial is neither.
3. Maximum and Minimum Values of Functions
Definitions
Absolute (Global) Maximum: The highest y-value over the entire domain of the function.
Relative (Local) Maximum: The highest y-value within a certain interval (neighborhood).
Absolute (Global) Minimum: The lowest y-value over the entire domain.
Relative (Local) Minimum: The lowest y-value within a certain interval.
Way to Remember: Absolute = Global (entire domain), Relative = Local (neighborhood).
4. Increasing, Decreasing, and Constant Intervals
Definitions
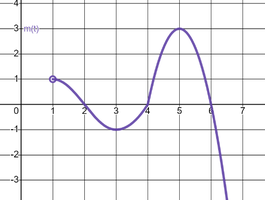
Increasing Interval: The function rises as x increases. For all in the interval, .
Decreasing Interval: The function falls as x increases. For all , .
Constant Interval: The function remains unchanged as x increases. For all , .
5. Piecewise Functions
Definition and Analysis
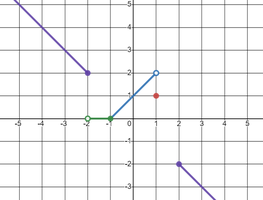
A piecewise function is defined by different expressions for different intervals of the domain. To analyze a piecewise function:
Identify the intervals and the corresponding expressions.
Check for continuity and endpoints (open or closed circles on the graph).
Evaluate the function at specific points and describe its behavior on each interval.
6. The Difference Quotient
Definition and Purpose
The difference quotient is a formula that measures the average rate of change (slope) of a function over an interval. It is foundational for calculus and is defined as:
First, compute by substituting into the function.
Subtract from , then divide by .
For linear functions, the difference quotient is always a constant.
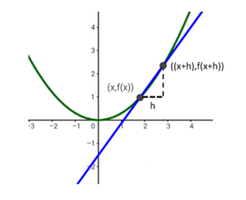
Example: For , the difference quotient is:
Simplify to find the average rate of change over the interval from to .
7. Summary Table: Symmetry Tests
Symmetry Type | Test | Result | Classification |
|---|---|---|---|
y-axis | Replace x with -x | If | Even |
Origin | Replace x with -x | If | Odd |
x-axis | Replace y with -y | If is on the graph | Not a function |
y = x | Swap x and y | If is on the graph | Inverse |
8. Key Vocabulary
Relation: Any set of ordered pairs (x, y).
Function: A relation where each input (x) has exactly one output (y).
1-to-1 Function: A function where each output (y) is paired with exactly one input (x).
Zeroes: The x-values where (also called roots or x-intercepts).
