 Back
Linear Functions and Slope: Applications and Modeling
Study Guide - Smart Notes
 Tailored notes based on your materials, expanded with key definitions, examples, and context.
Linear Functions and Slope
Definition and Key Concepts
Linear functions are algebraic expressions that describe a straight line when graphed on a coordinate plane. The general form of a linear equation is y = mx + b, where m is the slope and b is the y-intercept. Understanding how to calculate and interpret slope, as well as how to write equations of lines, is fundamental in precalculus and real-world modeling.
Slope (m): The measure of the steepness of a line, calculated as the ratio of the change in y to the change in x between two points.
Slope-Intercept Form:
Point-Slope Form: , where is a known point on the line.
Finding the Slope Between Two Points
Given two points, and , the slope m is calculated as:
Example: Find the slope of the line passing through (1, -5) and (-4, 3):
Writing Equations of Lines
To write the equation of a line, you need either a point and the slope, or two points. Use the point-slope form and rearrange to slope-intercept form if needed.
Given a slope and a point: For slope and point (3, 2):
Given two points: For points (-1, 4) and (2, -3): Use point-slope form with (-1, 4):
Graphing Linear Equations
To graph a line given in slope-intercept form, plot the y-intercept and use the slope to find another point. Draw a straight line through these points.
Applications of Linear Functions
Temperature Conversion: Celsius and Fahrenheit
The relationship between Celsius (C) and Fahrenheit (F) temperatures is linear. The freezing and boiling points of water provide two points: (0, 32) and (100, 212).
Find the linear function: Slope: Equation:
Example: Find F when C = 30:
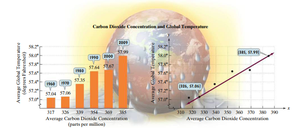
Modeling with Real-World Data: Carbon Dioxide and Global Temperature
Linear functions can model the relationship between atmospheric carbon dioxide concentration and average global temperature. Given two data points, (326, 57.06) and (385, 57.99):
Find the slope:
Equation using point-slope form (with x = 326, y = 57.06):
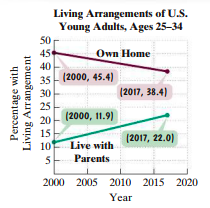
Modeling Social Trends: Living Arrangements of Young Adults
Linear functions can also model social trends, such as the percentage of young adults who own a home or live with their parents. For example, using the points (2000, 45.4) and (2017, 38.4) for home ownership, and (2000, 11.9) and (2017, 22.0) for living with parents:
Home Ownership: (where x is years after 2000; solve for b using a point)
Living with Parents:
Intersection Point: Set and solve for x to find when the percentages are equal.

Modeling Demographic Trends: One-Person Households
Bar graphs and line graphs can be used to model the percentage of one-person households in the U.S. over time. Using the points (10, 24.6) and (20, 25.8), where x is years after 1980:
Point-Slope Form:
Slope-Intercept Form:
Find x when y = 30: So, 55 years after 1980, or in 2035, the percentage is projected to reach 30%.
Summary Table: Forms of Linear Equations
Form | Equation | When to Use |
|---|---|---|
Slope-Intercept | When you know the slope and y-intercept | |
Point-Slope | When you know the slope and a point | |
Standard | General form, useful for certain algebraic manipulations |
