 Back
BackLinear Functions and Slope: Study Notes for Precalculus
Study Guide - Smart Notes
 Tailored notes based on your materials, expanded with key definitions, examples, and context.
Linear Functions and Slope
Introduction to Linear Equations and Functions
Linear equations and linear functions are foundational concepts in precalculus, describing relationships with constant rates of change. Understanding their properties is essential for analyzing graphs and solving real-world problems.
Linear Equation: An equation of the form , where m is the slope and b is the y-intercept.
Linear Function: A function that can be written as .
Key Feature: The graph of a linear function is always a straight line.
Slope of a Linear Function/Equation
The slope of a line measures its steepness and direction. It is a crucial parameter in both equations and graphs of lines.
Definition: The slope m between two points and is given by:
Interpretation: Slope represents the rate of change of y with respect to x.
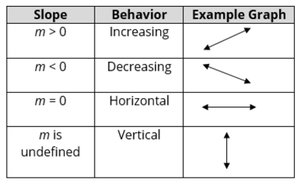
Behavior of Lines Based on Slope
The orientation and behavior of a line depend on the value of its slope. The table below summarizes the main cases:
Slope | Behavior | Example Graph |
|---|---|---|
m > 0 | Increasing | ↗ |
m < 0 | Decreasing | ↘ |
m = 0 | Horizontal | → |
m is undefined | Vertical | ↑ |
Parallel Lines: Have the same slope.
Perpendicular Lines: Have slopes that are negative reciprocals (i.e., ).
Skewed Lines: Lines that are neither parallel nor perpendicular.
Slope as Average Rate of Change
The slope can also be interpreted as the average rate of change of a function between two points. This concept is fundamental in calculus and applied mathematics.
Formula: For a function , the average rate of change from to is:
Application: Used to estimate how a quantity changes over an interval.
Applications: Linear Modeling in Business
Revenue, Cost, and Profit Equations
Linear models are widely used in business to analyze revenue, cost, and profit. Consider the example of Sassy Surf Creations, a clothing manufacturer.
Revenue Equation: , where p is the price per item and x is the number of items sold.
Cost Equation: , where m is the variable cost per item and b is the fixed cost.
Profit Equation: .
Example: Suppose 200 shirts cost $2050 and 100 shirts cost $1300. Shirts sell for $15 each.
Find the cost per shirt (slope):
Write the cost equation using one data point :
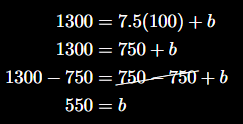
So,
Revenue:
Profit:
Break-Even Point
The break-even point is where revenue equals cost, and profit is zero. This is a critical value for businesses to determine minimum sales for profitability.
Set :
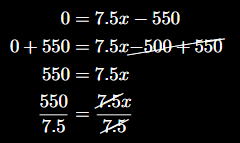
Interpretation: The company must sell at least 74 shirts to break even.
Summary Table: Slope and Line Behavior
The following table summarizes how the value of the slope affects the behavior of a line:
Slope | Behavior | Example Graph |
|---|---|---|
m > 0 | Increasing | ↗ |
m < 0 | Decreasing | ↘ |
m = 0 | Horizontal | → |
m is undefined | Vertical | ↑ |
Additional info:
Parallel and perpendicular lines are important for solving systems of equations (see Section 7.1).
Average rate of change is a precursor to the concept of the derivative in calculus.
