Back
More on Functions and Their Graphs: Increasing/Decreasing Intervals, Extrema, and Symmetry
Study Guide - Smart Notes
 Tailored notes based on your materials, expanded with key definitions, examples, and context.
Increasing, Decreasing, and Constant Functions
Definitions and Graphical Interpretation
Understanding how a function behaves on an interval is fundamental in precalculus. A function can be classified as increasing, decreasing, or constant on an open interval based on the relationship between its input and output values.
Increasing on an interval I: For any in , .
Decreasing on an interval I: For any in , .
Constant on an interval I: For any in , .
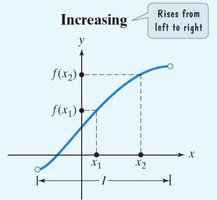
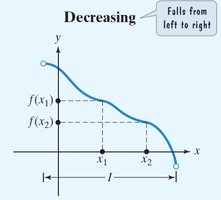
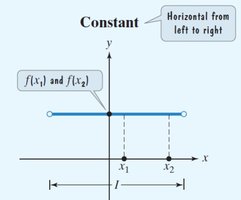
When describing intervals of increase, decrease, or constancy, always use open intervals (parentheses), and read the graph from left to right. The intervals are given in terms of x-values, indicating where the function rises, falls, or remains unchanged.
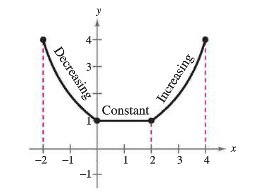
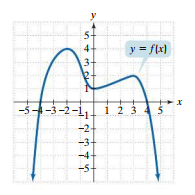
Example: For the graph below, the function is:
Decreasing on
Constant on
Increasing on
Relative Maxima and Minima
Definitions and Identification
A function may attain local high or low points, called relative maxima and relative minima, within an open interval. These points are important for analyzing the overall behavior of the function.
Relative Maximum at : is a relative maximum if there exists an open interval containing such that for all in the interval.
Relative Minimum at : is a relative minimum if there exists an open interval containing such that for all in the interval.
The maximum or minimum value is the y-value; the location is the corresponding x-value.
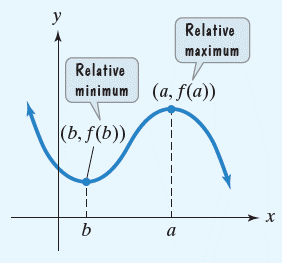
Example: Identify the numbers at which has a relative maximum and minimum, and state these values.
Tests for Symmetry
Definition and Algebraic Tests
Symmetry in graphs helps classify functions and predict their behavior. There are three main types of symmetry:
y-axis symmetry: For every on the graph, is also on the graph. Test by replacing with in the equation; if the equation is unchanged, the graph is symmetric about the y-axis.
x-axis symmetry: For every on the graph, is also on the graph. Test by replacing with in the equation; if unchanged, the graph is symmetric about the x-axis.
Origin symmetry: For every on the graph, is also on the graph. Test by replacing with and with ; if unchanged, the graph is symmetric about the origin.
Example: Determine algebraically whether is symmetric with respect to the y-axis, x-axis, or origin.
Even and Odd Functions
Definitions and Properties
Functions can be classified as even, odd, or neither based on their symmetry properties:
Even function: for all in the domain. The graph is symmetric with respect to the y-axis.
Odd function: for all in the domain. The graph is symmetric with respect to the origin.
To determine if a function is even, odd, or neither, evaluate and compare to .
Example: Determine whether the following functions are even, odd, or neither:
Applications and Practice
Analyzing Graphs for Function Properties
Use the graph of a function to answer questions about intervals of increase/decrease, relative extrema, and symmetry. For example, given a polynomial graph, you may be asked to:
Determine intervals where is increasing or decreasing
Find values of for which , , or
Identify relative maxima and minima
Classify the function as even, odd, or neither
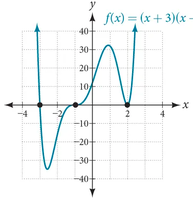
Example: For the function , analyze the graph to answer the following:
Intervals of increase and decrease
Relative maxima and minima
Values of for which , ,
Symmetry properties
Domain, Range, and Intercepts
Given a graph, you may also be asked to determine:
Domain: The set of all possible -values for which is defined.
Range: The set of all possible -values that attains.
x-intercepts: Points where the graph crosses the -axis ().
y-intercept: The point where the graph crosses the -axis ().