 Back
Polynomial and Rational Functions: Graphs, Models, and Applications
Study Guide - Smart Notes
 Tailored notes based on your materials, expanded with key definitions, examples, and context.
Polynomial and Rational Functions
Function Families and Power Functions
Polynomial and rational functions are foundational in precalculus, modeling a wide range of real-world and theoretical phenomena. Understanding their graphs, transformations, and properties is essential for further study in mathematics.
Polynomial Functions: Functions of the form , where is a non-negative integer and coefficients are real numbers.
Rational Functions: Functions expressed as the ratio of two polynomials, , where .
Power Functions: Functions of the form , where and are real numbers. The behavior of these functions depends on whether $n$ is even, odd, positive, or negative.
Graphing Power Functions and Their Transformations
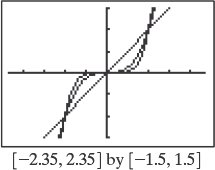
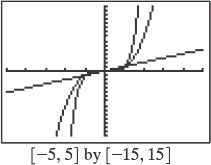
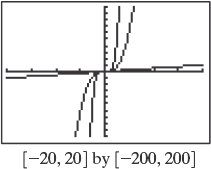
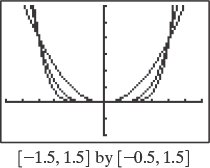
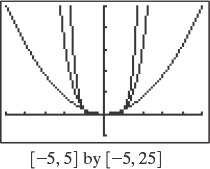
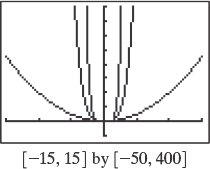
The graphs of power functions change dramatically with the value and sign of the exponent. Transformations such as vertical stretching, shrinking, reflecting, and translating affect the shape and position of these graphs.
Even Powers: Graphs are symmetric about the y-axis (even functions), opening upwards for positive coefficients.
Odd Powers: Graphs are symmetric about the origin (odd functions), passing through the origin and increasing or decreasing without bound.
Vertical Stretch/Shrink: Multiplying by a constant stretches () or shrinks () the graph vertically.
Reflection: Multiplying by reflects the graph across the x-axis.
Translation: Adding or subtracting constants shifts the graph horizontally or vertically.
Linear Functions and Their Graphs
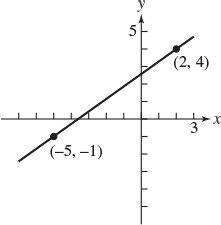
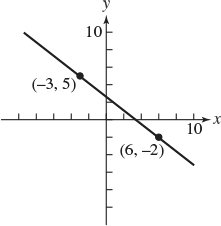
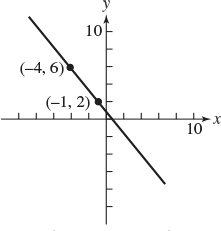
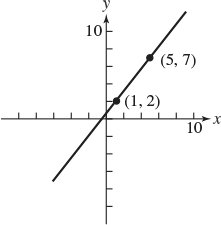
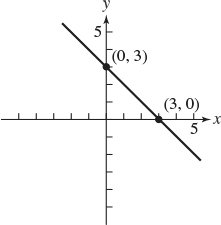
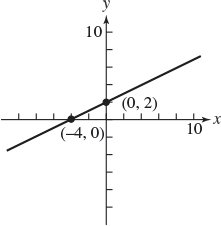
Linear functions are the simplest polynomial functions, with the general form . Their graphs are straight lines, and the slope represents the rate of change.
Slope: The change in per unit change in , calculated as .
Y-intercept: The value of when .
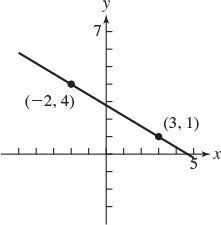
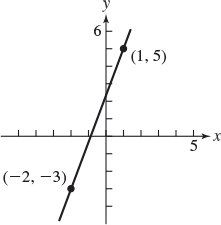
Graphing: Two points determine a unique line.
Quadratic Functions and Parabolas
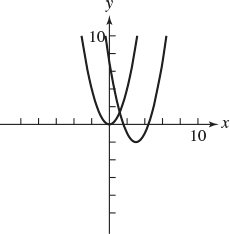
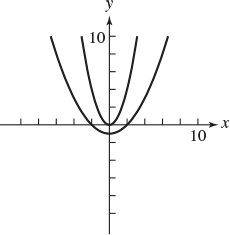
Quadratic functions have the form and their graphs are parabolas. The vertex form, , highlights the vertex and the direction of opening.
Vertex: The highest or lowest point of the parabola, found at .
Axis of Symmetry: The vertical line passing through the vertex.
Direction: Opens upward if , downward if .
Transformations: Vertical/horizontal shifts, stretches, and reflections affect the graph's position and shape.
Scatterplots, Linear Regression, and Residuals
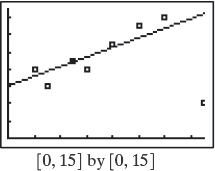
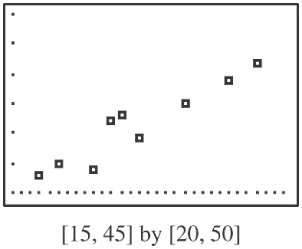
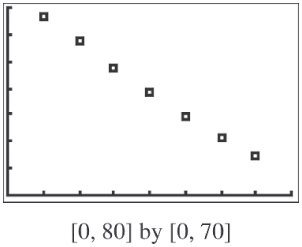
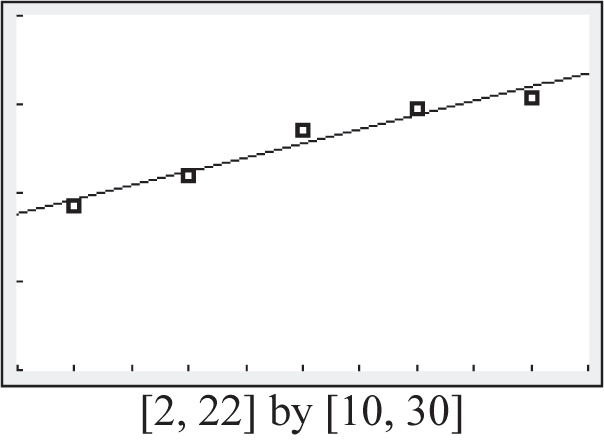
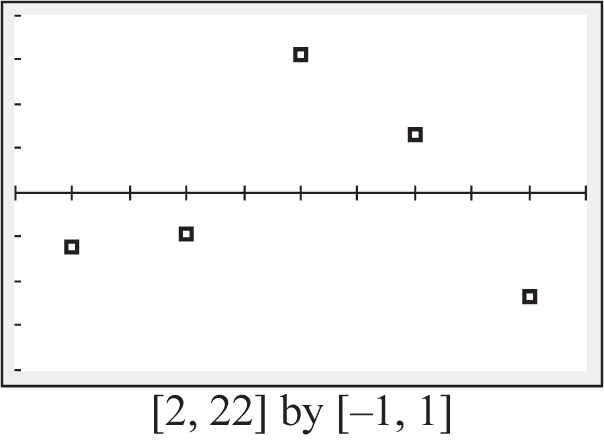
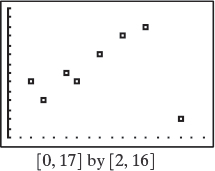
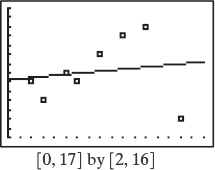
Scatterplots are used to visualize the relationship between two variables. Linear regression finds the best-fit line, and residuals measure the difference between observed and predicted values.
Scatterplot: A graph of points representing paired data.
Regression Line: The line that minimizes the sum of squared residuals (least-squares line).
Residuals: The vertical distances from each data point to the regression line.
Correlation Coefficient (): Measures the strength and direction of a linear relationship ().
Quadratic Modeling and Maximum/Minimum Problems
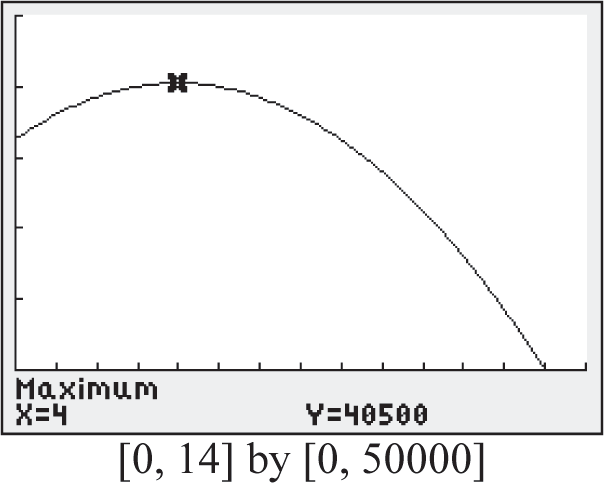
Quadratic functions are often used to model situations involving maximum or minimum values, such as revenue, area, or projectile motion.
Maximum/Minimum Value: The vertex of the parabola gives the maximum or minimum value of the function.
Applications: Used in business (maximizing profit or revenue), physics (projectile motion), and geometry (maximizing area or volume).
Summary Table: Key Properties of Polynomial and Rational Functions
Function Type | General Form | Graph Shape | Key Features |
|---|---|---|---|
Linear | Straight line | Slope, y-intercept | |
Quadratic | Parabola | Vertex, axis of symmetry, direction | |
Cubic | S-shaped curve | Inflection point, end behavior | |
Rational | Varies (asymptotes, holes) | Vertical/horizontal asymptotes, holes |
Example: Finding the Equation of a Line
Given two points and , the equation of the line passing through them is:
Slope:
Point-slope form:
Simplify to slope-intercept form:
Example: Quadratic Vertex and Axis of Symmetry
For :
Vertex:
Axis of symmetry:
Example: Linear Regression Interpretation
Given a regression line fitted to data, represents the average rate of change, and is the predicted value when . The strength of the fit is measured by the correlation coefficient .
Conclusion
Polynomial and rational functions provide powerful tools for modeling, analyzing, and solving a wide variety of mathematical and real-world problems. Mastery of their properties, graphs, and transformations is essential for success in precalculus and beyond.
